
First Run
Now that TWS is configured, let’s start OptionsRealTime and connect to your account.
Step 1: Start Rover
Section titled “Step 1: Start Rover”Rover manages an account analyzer process for each account and ensures these analyzers stay available if issues occur. Analyzers compute real-time analytics from TWS market data and publish them through NATS, the messaging server, where any number of processes can subscribe.
- Open the OptionsRealTime folder on your desktop
- Double-click Rover
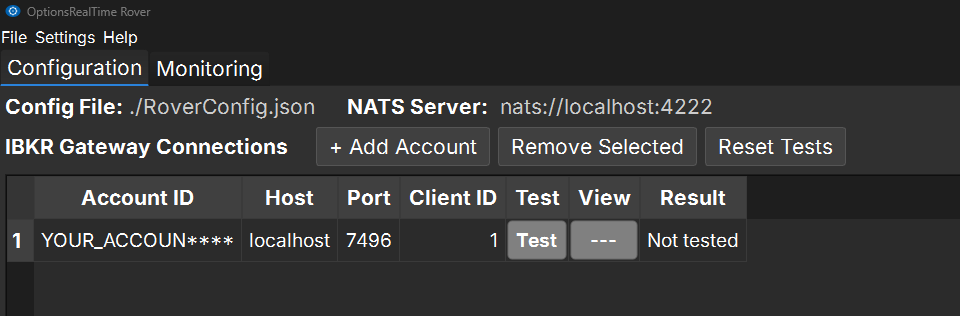
Rover opens on the Configuration view:
- A Web UI button at the top, showing the address browsers use to reach OptionsRealTime (e.g.,
http://MyMachineName.local:5000) - The IBKR Gateway Connections table, with + Add TWS App, + Add Account, Remove Selected, and Reset Tests above it
- One TWS App 1 group row holding the connection defaults (
localhost, port7496), with a single account row beneath it, pre-filled with a placeholder account ID and the nameIBKR_ACCT_1 - Start Account Analyzers at the bottom
- A status bar reading
NATS: Disconnected,Uptime: --:--:--, andAccounts 0/0until you start
Step 2: Enter Account Details
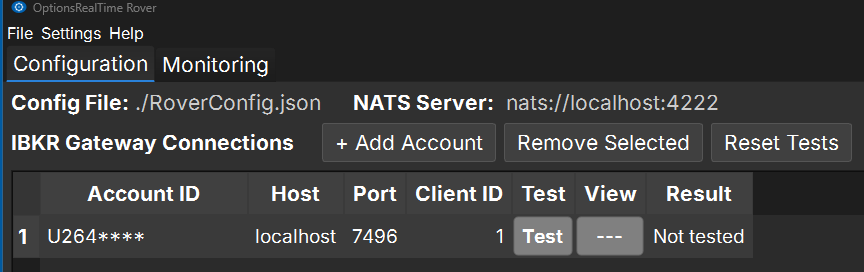
Section titled “Step 2: Enter Account Details”- Click the account row’s TWS App / Account ID field and enter the IBKR account ID (e.g.,
U1234567) - Edit the Account Name in the next column (e.g.,
PAPER)
The Host and Port on the account row match the TWS App 1 row above it: both point at the same TWS session.
Step 3: Test and Save
Section titled “Step 3: Test and Save”- Click the Test button in your account’s row
- The View column turns green and reads PASS on success, and the Result column reads
Valid IP:Port - Go to File > Save (Ctrl+S) to save your configuration
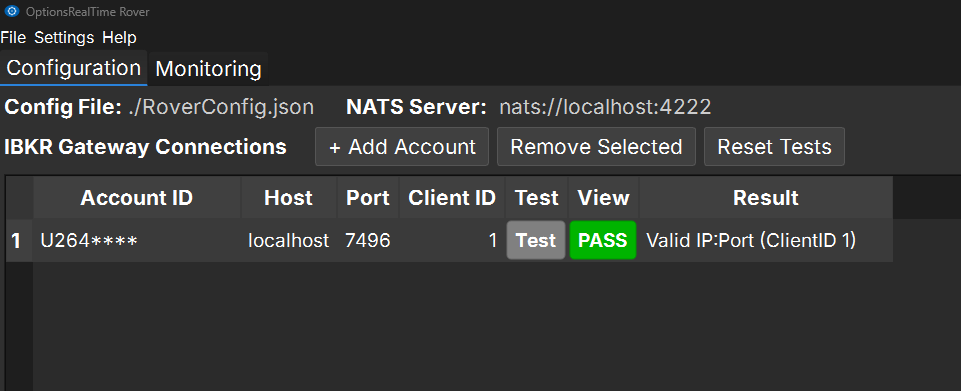
Reset Tests clears the results for every row so you can re-run them after changing TWS settings.
Step 4: Activate License
Section titled “Step 4: Activate License”When you click Start Account Analyzers for the first time, you’ll see:
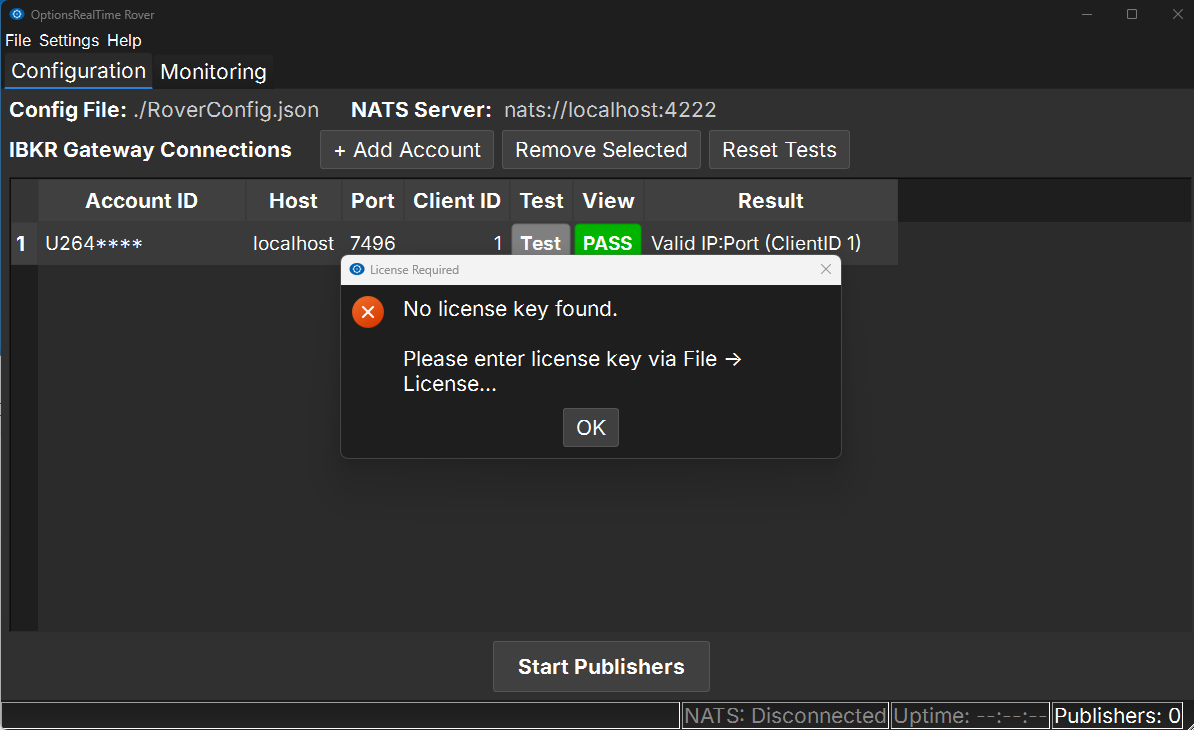
Click OK, then go to File > License…:
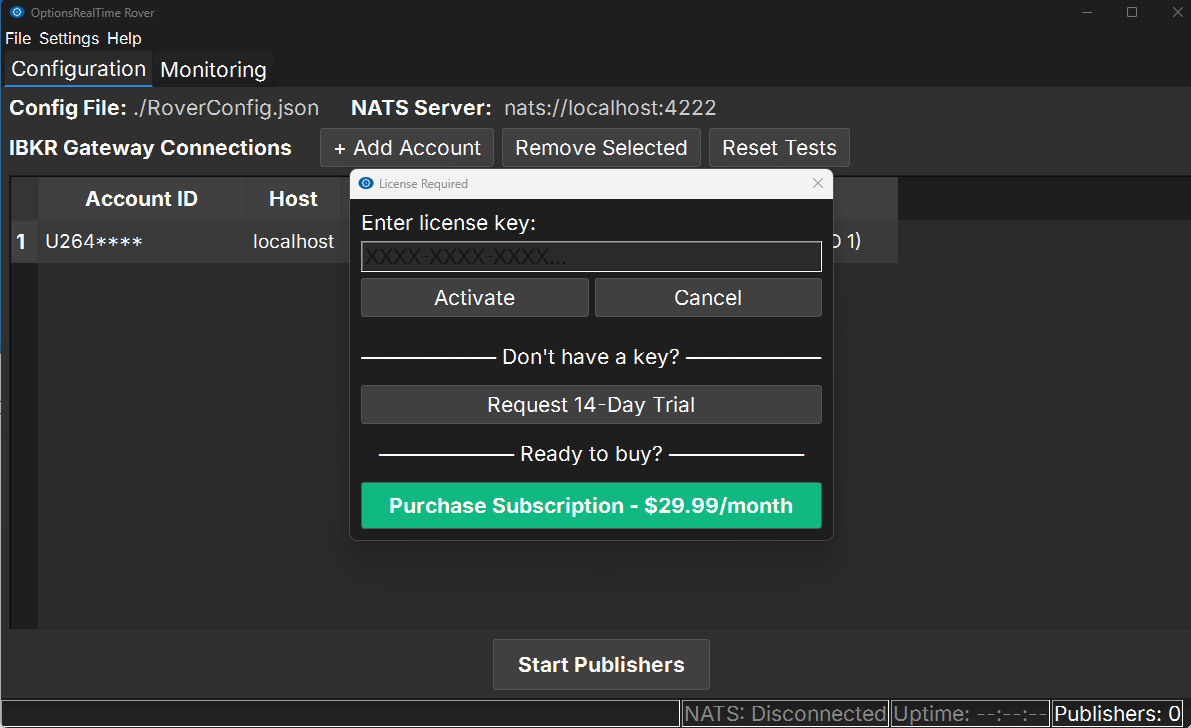
Click Request 14-Day Trial:
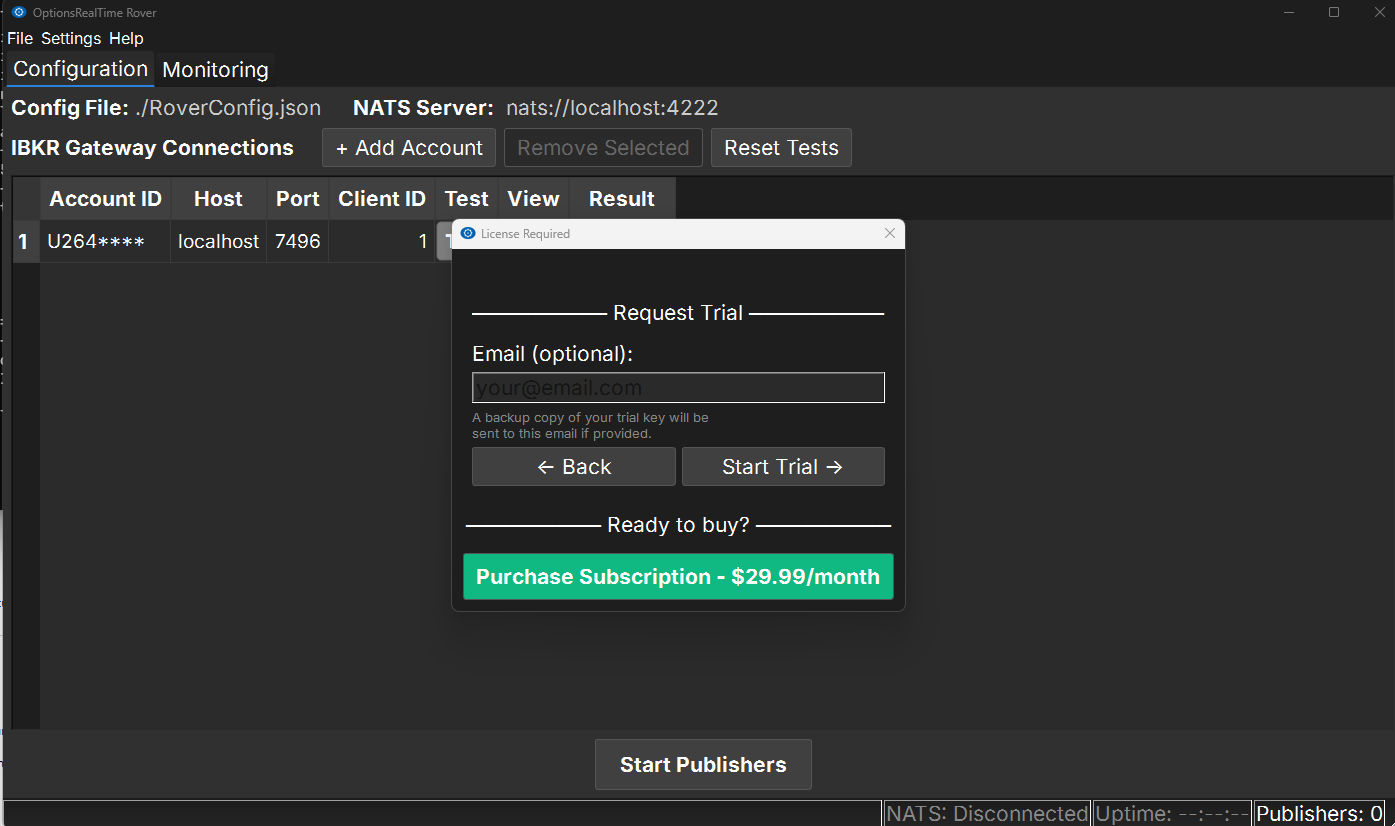
Enter your email (optional - for backup copy of trial key) and click Start Trial:
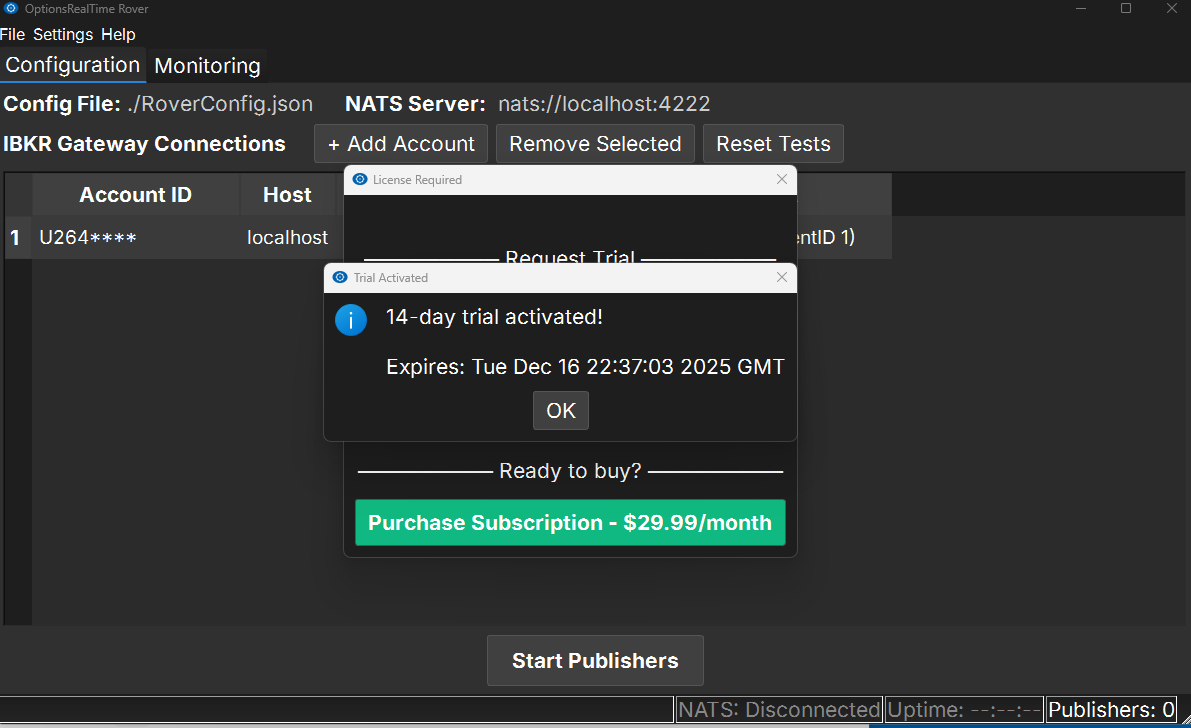
Click OK and you’re ready to publish.
Step 5: Start Account Analyzers
Section titled “Step 5: Start Account Analyzers”- Click Start Account Analyzers
- Rover will begin streaming data from TWS
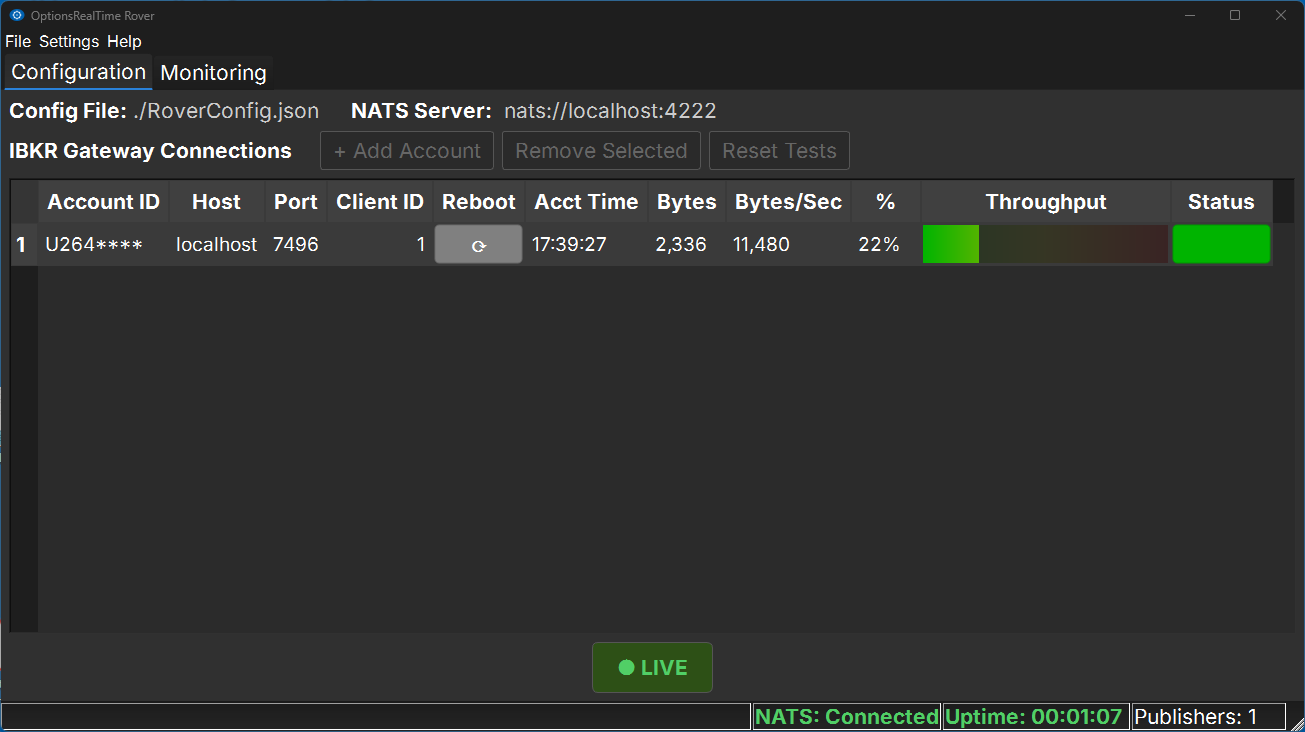
Once running, the table keeps its TWS App grouping but swaps the setup columns (Test, View, Result) for live ones:
- % — current throughput as a percentage of the configured Throughput Baseline
- Data Flow — a live bar showing data moving from the analyzer to connected clients
- Status — uptime for that analyzer, green when healthy
A green LIVE badge appears below the table, and the status bar now reads NATS: Connected, an application uptime, and Accounts 1/1.
Step 6: Launch OptionsRealTime
Section titled “Step 6: Launch OptionsRealTime”Click the Web UI button at the top of Rover, or open any browser on your network and type the address shown on the button. For example: http://MyMachineName.local:5000
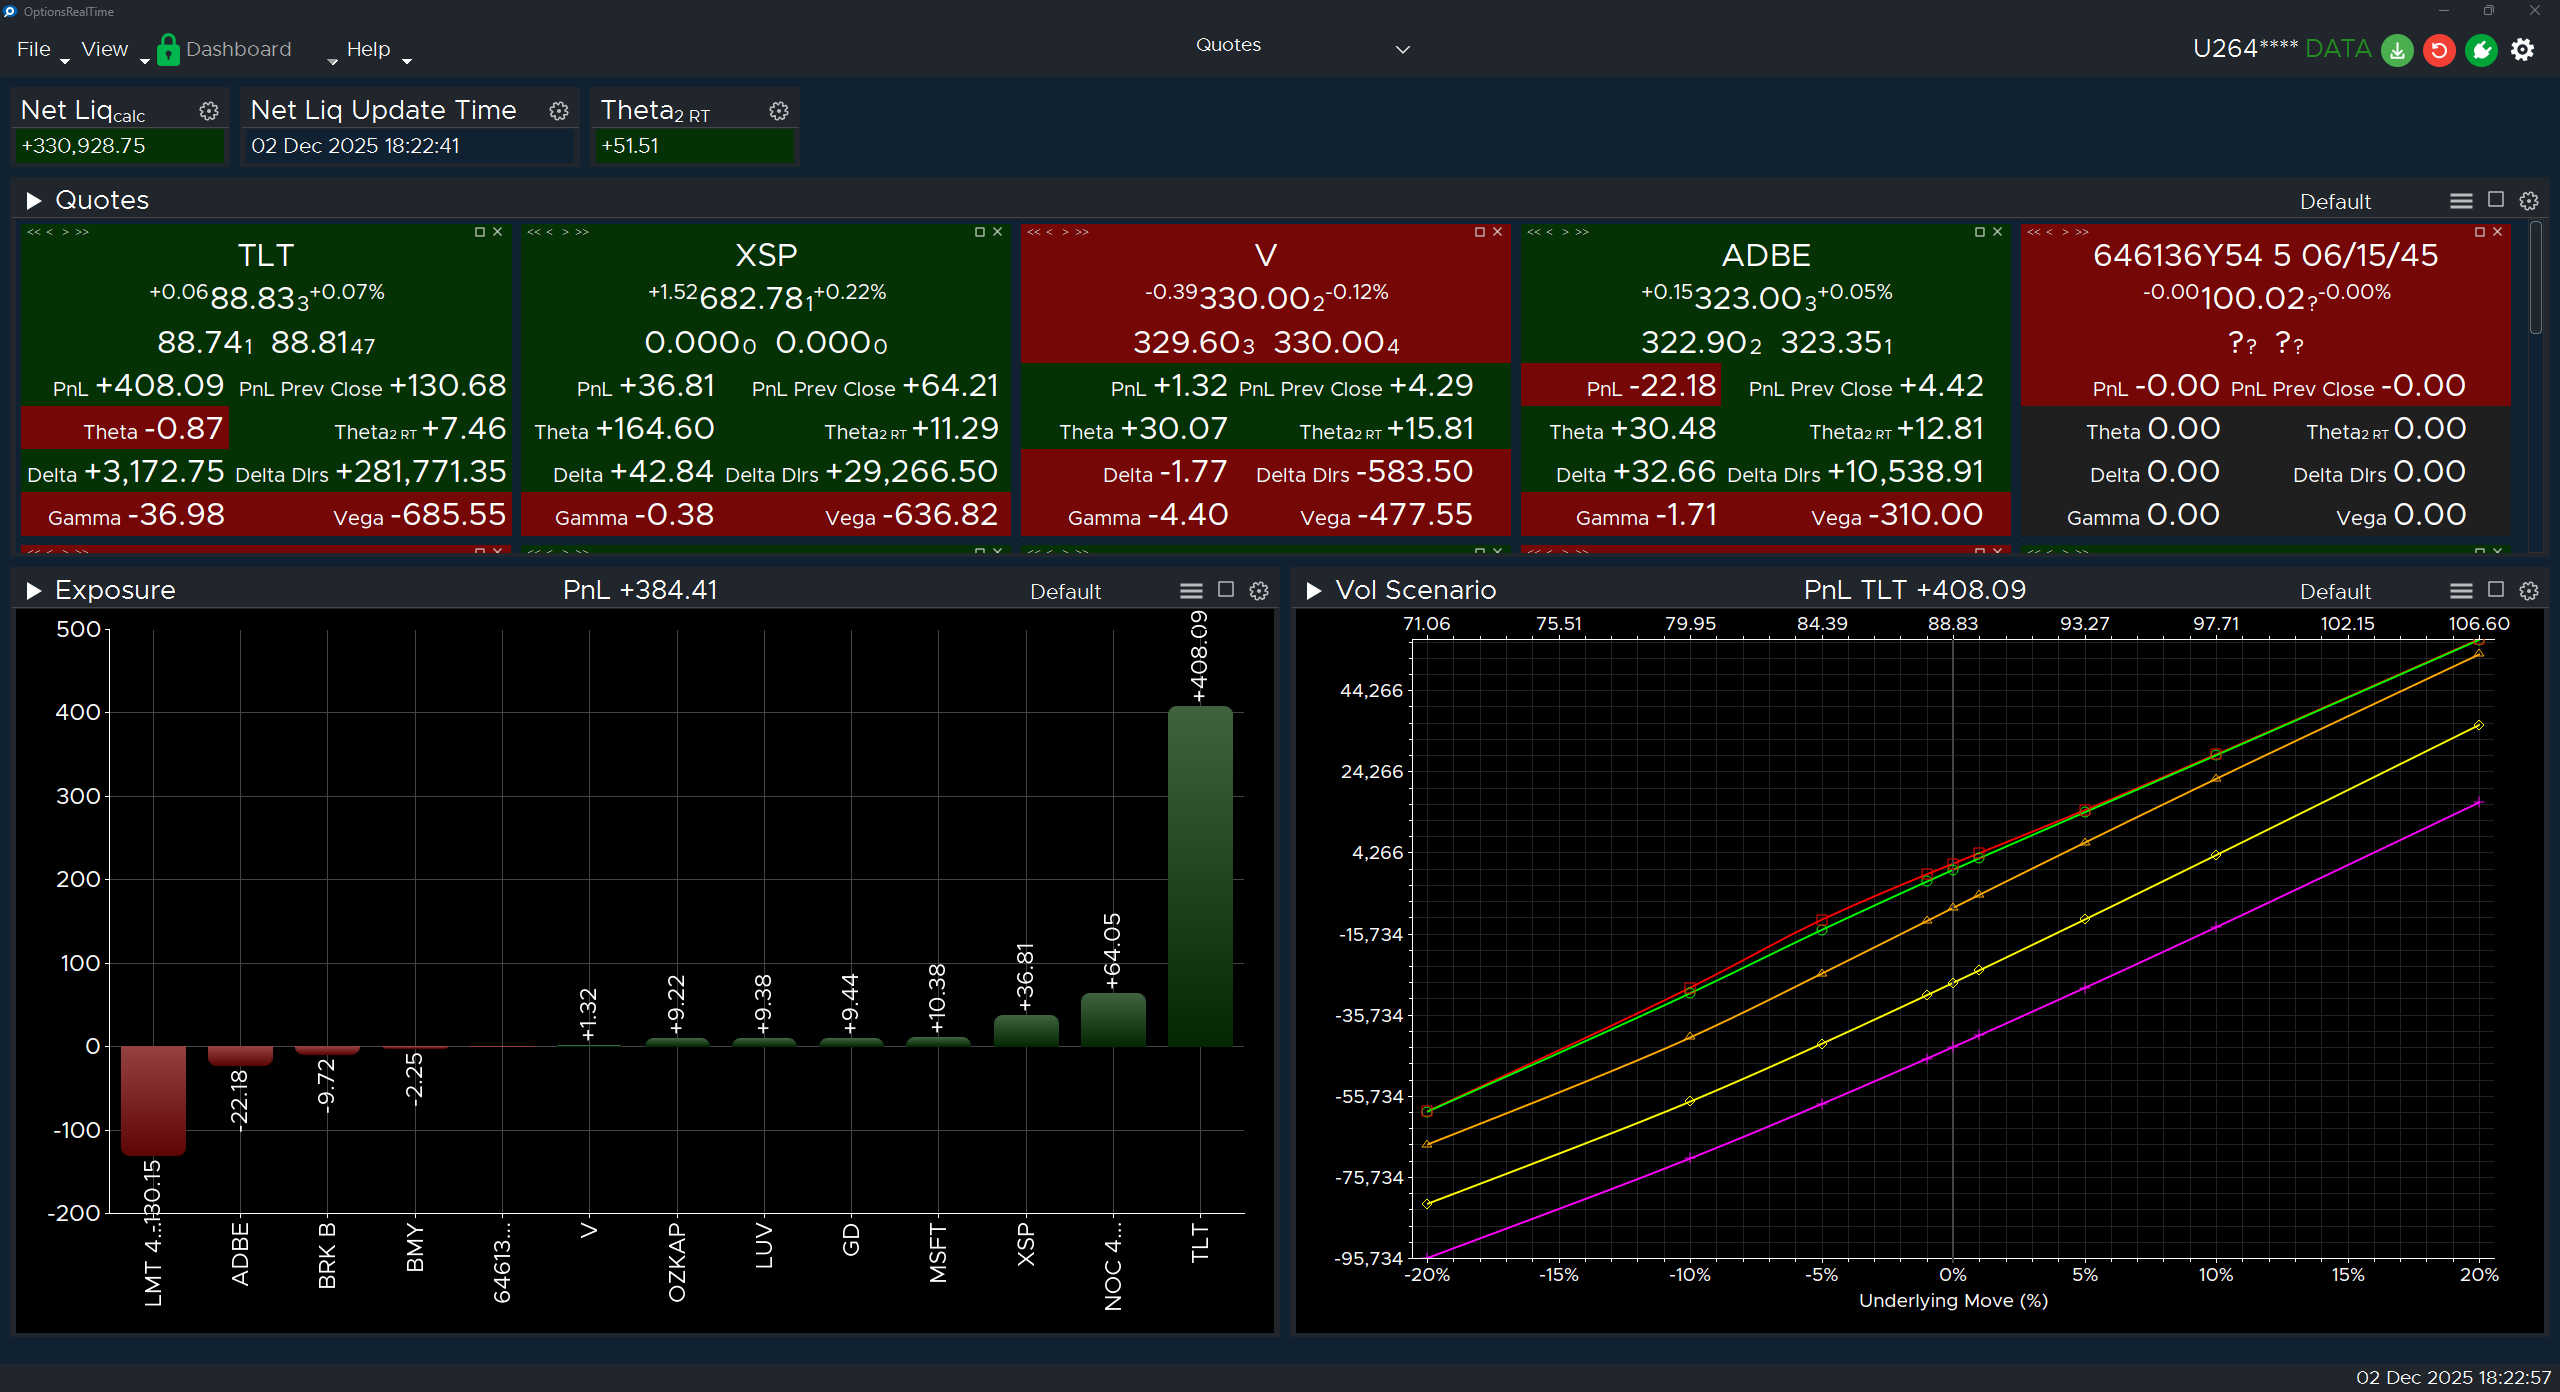
OptionsRealTime reflects:
- All your positions, loaded from TWS
- Live market data for all underlyings and options
Optional: Developer Tools
Section titled “Optional: Developer Tools”The default Rover view is deliberately minimal. If you want more visibility while getting set up, open Settings > Developer Tools and enable any of:
- Show Monitoring tab — live portfolio metrics aggregated across accounts
- Show Configuration logs pane — an integrated log console, with a tab per analyzer
- Show throughput columns — per-row Acct Time and byte counters
- Show Restart buttons — Test and Reboot controls on each row while running
- Show Client ID column — the client ID Rover assigned to each connection
These toggles are saved with the configuration and restored the next time Rover launches. Full detail in Rover.
Next Steps
Section titled “Next Steps”Learn about Components
Every metric, chart, quote, report, and table can be tailored to your workflow.
Multiple Accounts
Add more IBKR accounts.
Rover Reference
Every setting, column, and menu item in Rover.