Rover Account Analyzer Launcher and Monitor
Rover is the central hub for managing connections between Interactive Brokers TWS instances and the OptionsRealTime data stream. It launches and monitors account analyzer processes that feed real-time portfolio data to all connected clients, including the web browser UI and Excel.
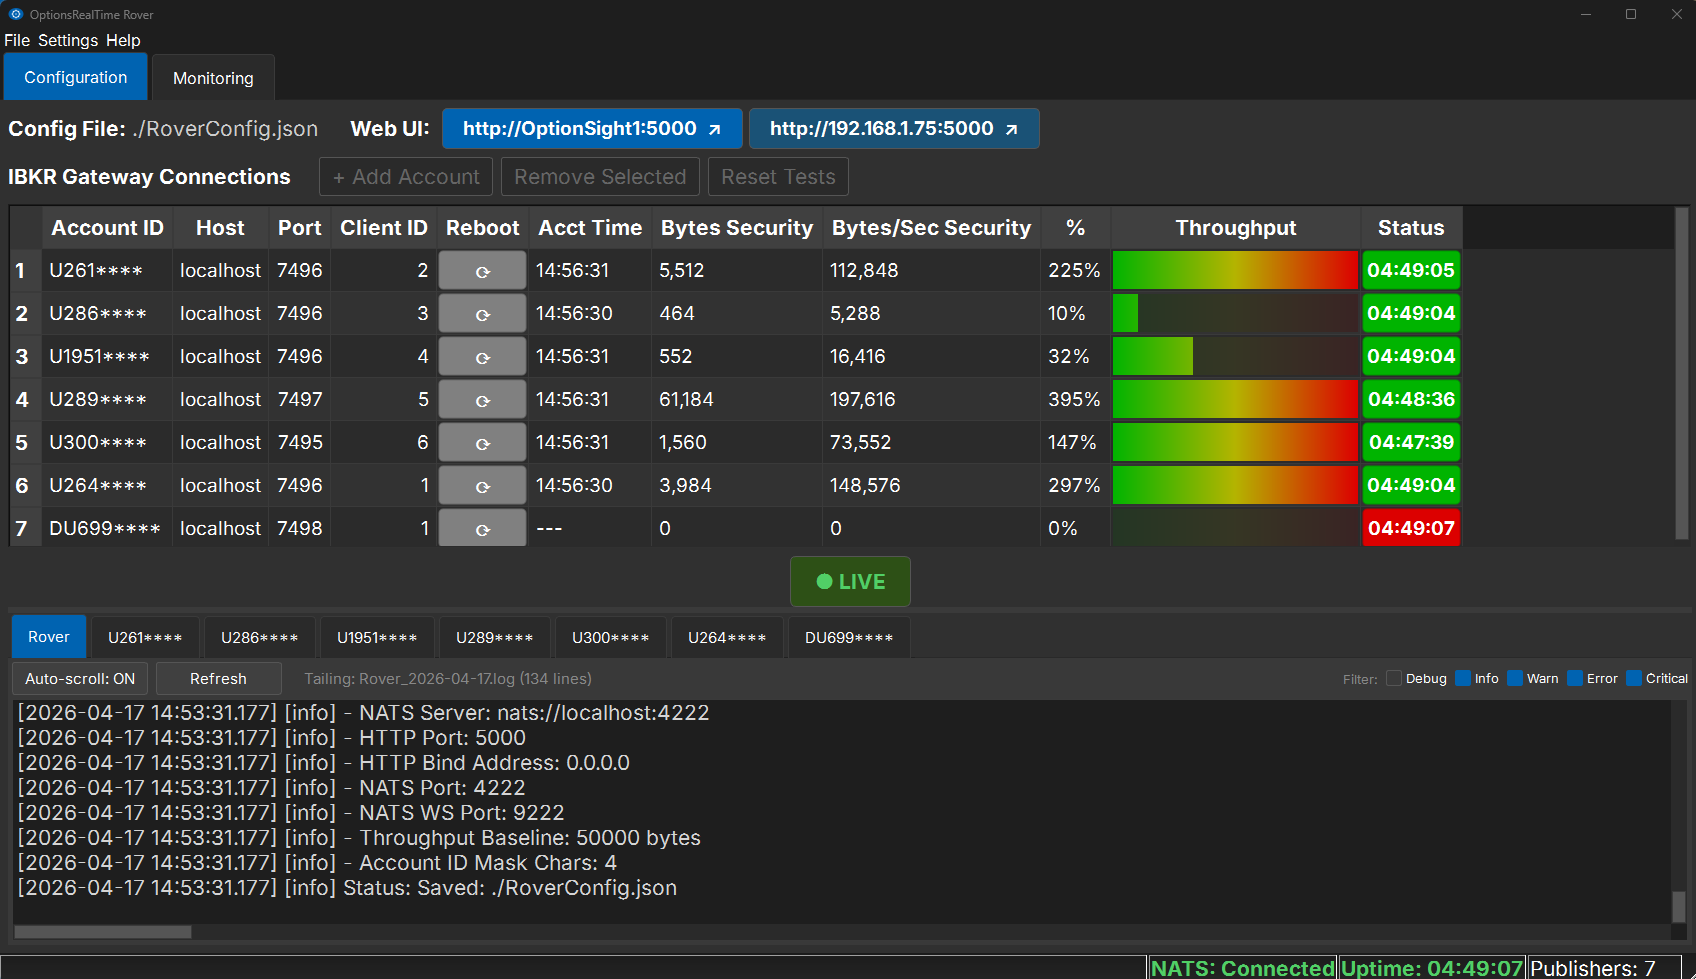
Rover with all Developer Tools enabled: connections table, Monitoring and log panes, and throughput columns. The default view is more minimal (see below).
Overview
Section titled “Overview”Rover manages the complete lifecycle of account analyzer processes. Each analyzer connects to a TWS Desktop or Gateway instance and streams portfolio data over NATS to any listening client. A single Rover instance can manage multiple accounts across multiple TWS installations, whether those TWS instances are running locally or on remote machines. Beyond launching analyzers, Rover continuously monitors each process. If any analyzer dies due to data disconnections or other failures, a new instance is immediately spawned, reconnecting to TWS, downloading all positions, subscribing to feeds, and resuming analytics streaming.
Default View
Section titled “Default View”Rover’s default view is intentionally minimal. Traders see only what they need: a connections table, a Web UI button, and live status indicators. Power-user features such as monitoring metrics, log panes, throughput columns, and per-row restart buttons are available on demand through Settings → Developer Tools.
The default view shows:
- Web UI button at the top: opens the OptionsRealTime web UI using the machine’s hostname (e.g.,
http://OptionSight1.local:5000). Designed to be reachable from any device on the LAN that can resolve mDNS names, including Mac and iPhone. - IBKR Gateway Connections table: one row per account showing Account ID, Account Name, Host, Port, Client ID, and Status (uptime in green when healthy).
- LIVE indicator: confirms analyzers are running and streaming.
- Status bar: NATS connection state, application uptime, and accounts connected (e.g.,
Accounts 4/4).
Configuration
Section titled “Configuration”Account connections are defined in RoverConfig.json (see Rover Configuration for the full schema). Each row in the connections table represents one account:
- Account ID: IBKR account identifier
- Account Name: a unique, user-assigned label for the account, defaulting to
IBKR_ACCT_1,IBKR_ACCT_2, and so on. It is sent to connected clients, where accounts can be displayed by name instead of by ID. - Host: machine running TWS (use
localhostfor local installations) - Port: API port configured in TWS (typically 7496 for live, 7497 for paper)
- Client ID: unique identifier per connection (multiple accounts on the same TWS instance must have different client IDs)
Once connections are defined, click Start Account Analyzers to launch all analyzer processes. At this point, most configuration settings become locked to prevent changes while data is flowing. To modify settings, exit Rover, which gracefully stops all analyzers before closing.
Settings
Section titled “Settings”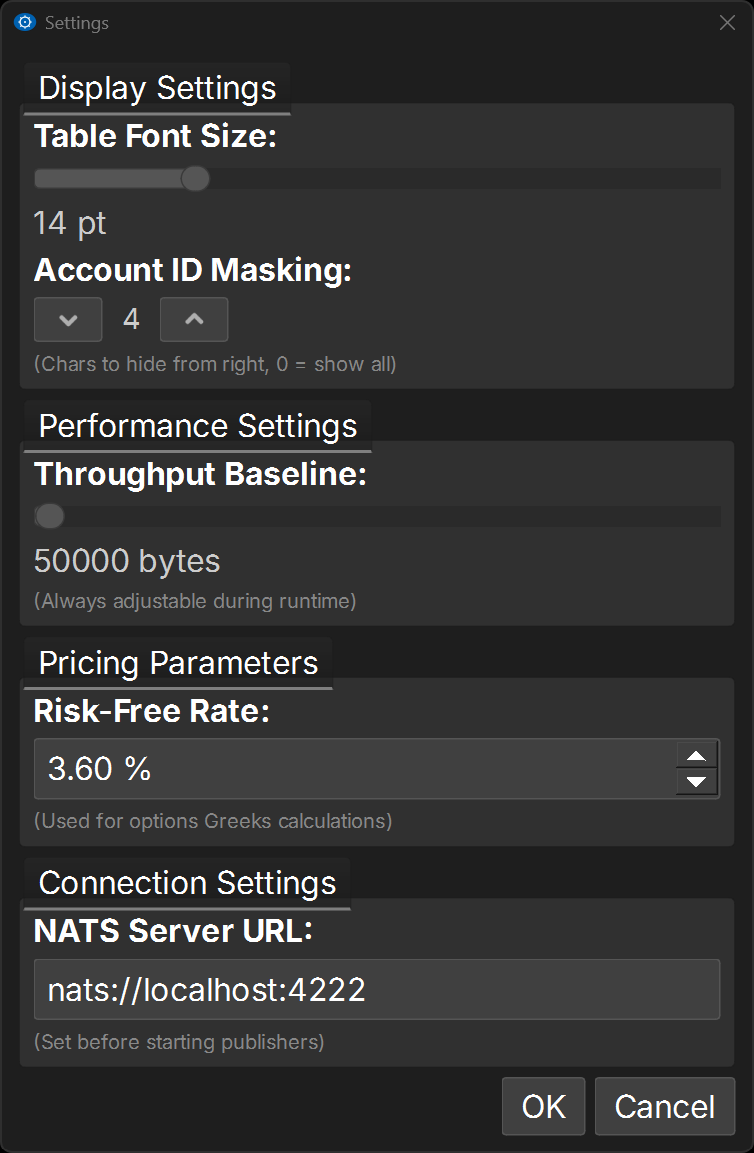
Access settings via Settings in the menu bar.
Display Settings
Section titled “Display Settings”-
Table Font Size: font size for the connections table
-
General Font Size: font size for surrounding labels and dialogs
-
Account ID Privacy: how the entered account ID is displayed in Rover’s connections table. The Account Name column sits next to it and is always shown, never masked. Three modes:
- Actual: the full account ID.
- Mask: a partial ID, controlled by a value from 0 to 10.
0shows the full ID; higher values hide more of it (for example,U123****). - Obfuscate: real IDs replaced with sequential placeholders (
U00000000,U00000001, and so on).
Use Mask or Obfuscate to hide real account numbers when sharing screens or capturing screenshots. In the browser, account ID display is controlled separately in Settings, which adds a Name mode that shows the Account Name set here.
Performance Settings
Section titled “Performance Settings”- Throughput Baseline: sets the 100% reference for the throughput bar chart (in bytes per second). Adjust based on typical data volume. Always adjustable during runtime.
Pricing Parameters
Section titled “Pricing Parameters”- Risk-Free Rates: the annualized interest rate used for options pricing calculations, set per currency. Each rate applies to securities denominated in that currency (USD, AED, AUD, BRL, CAD, CHF, CNH, CZK, DKK, EUR, GBP, HKD, HUF, ILS, JPY, KRW, MXN, MYR, NOK, NZD, PLN, RON, SAR, SEK, SGD, TRY, TWD, ZAR). For each currency, OptionsRealTime uses a flat rate model with QuantLib across all expirations, from short-dated options to LEAPS. While full yield curve models may be added in the future, options pricing is relatively insensitive to small rate variations, and a flat rate provides consistent results. Locked after application start; restart required to change.
Connection Settings
Section titled “Connection Settings”- NATS Server URL: the address of the NATS server. Locked after application start; restart required to change.
Connection URLs
Section titled “Connection URLs”- Hostname: the URL used by the front-end Web UI button (e.g.,
http://OptionSight1.local:5000). UsesName.local:Portformat for Mac and iPhone mDNS support. - IP address (fallback): the IP-based URL for clients that cannot resolve the hostname.
Configuration File
Section titled “Configuration File”Shows the path to the active RoverConfig.json.
Developer Tools
Section titled “Developer Tools”Optional toggles that expand the default Rover UI with additional panes and controls. Useful during development, troubleshooting, or deeper inspection. Session-only: all toggles reset to OFF on the next Rover launch.
- Show Monitoring tab: adds a Monitoring tab with live portfolio metrics aggregated across accounts
- Show Configuration logs pane: adds an integrated logging console below the connection table
- Show throughput columns: adds throughput columns to the connection table
- Show Restart buttons: adds Test and Reboot buttons to each row of the connection table
With every Developer Tool enabled, Rover expands to show all available panes and controls, as in the screenshot at the top of this page.
Monitoring (Developer Tool)
Section titled “Monitoring (Developer Tool)”Enable Show Monitoring tab in Settings → Developer Tools to add the Monitoring tab.
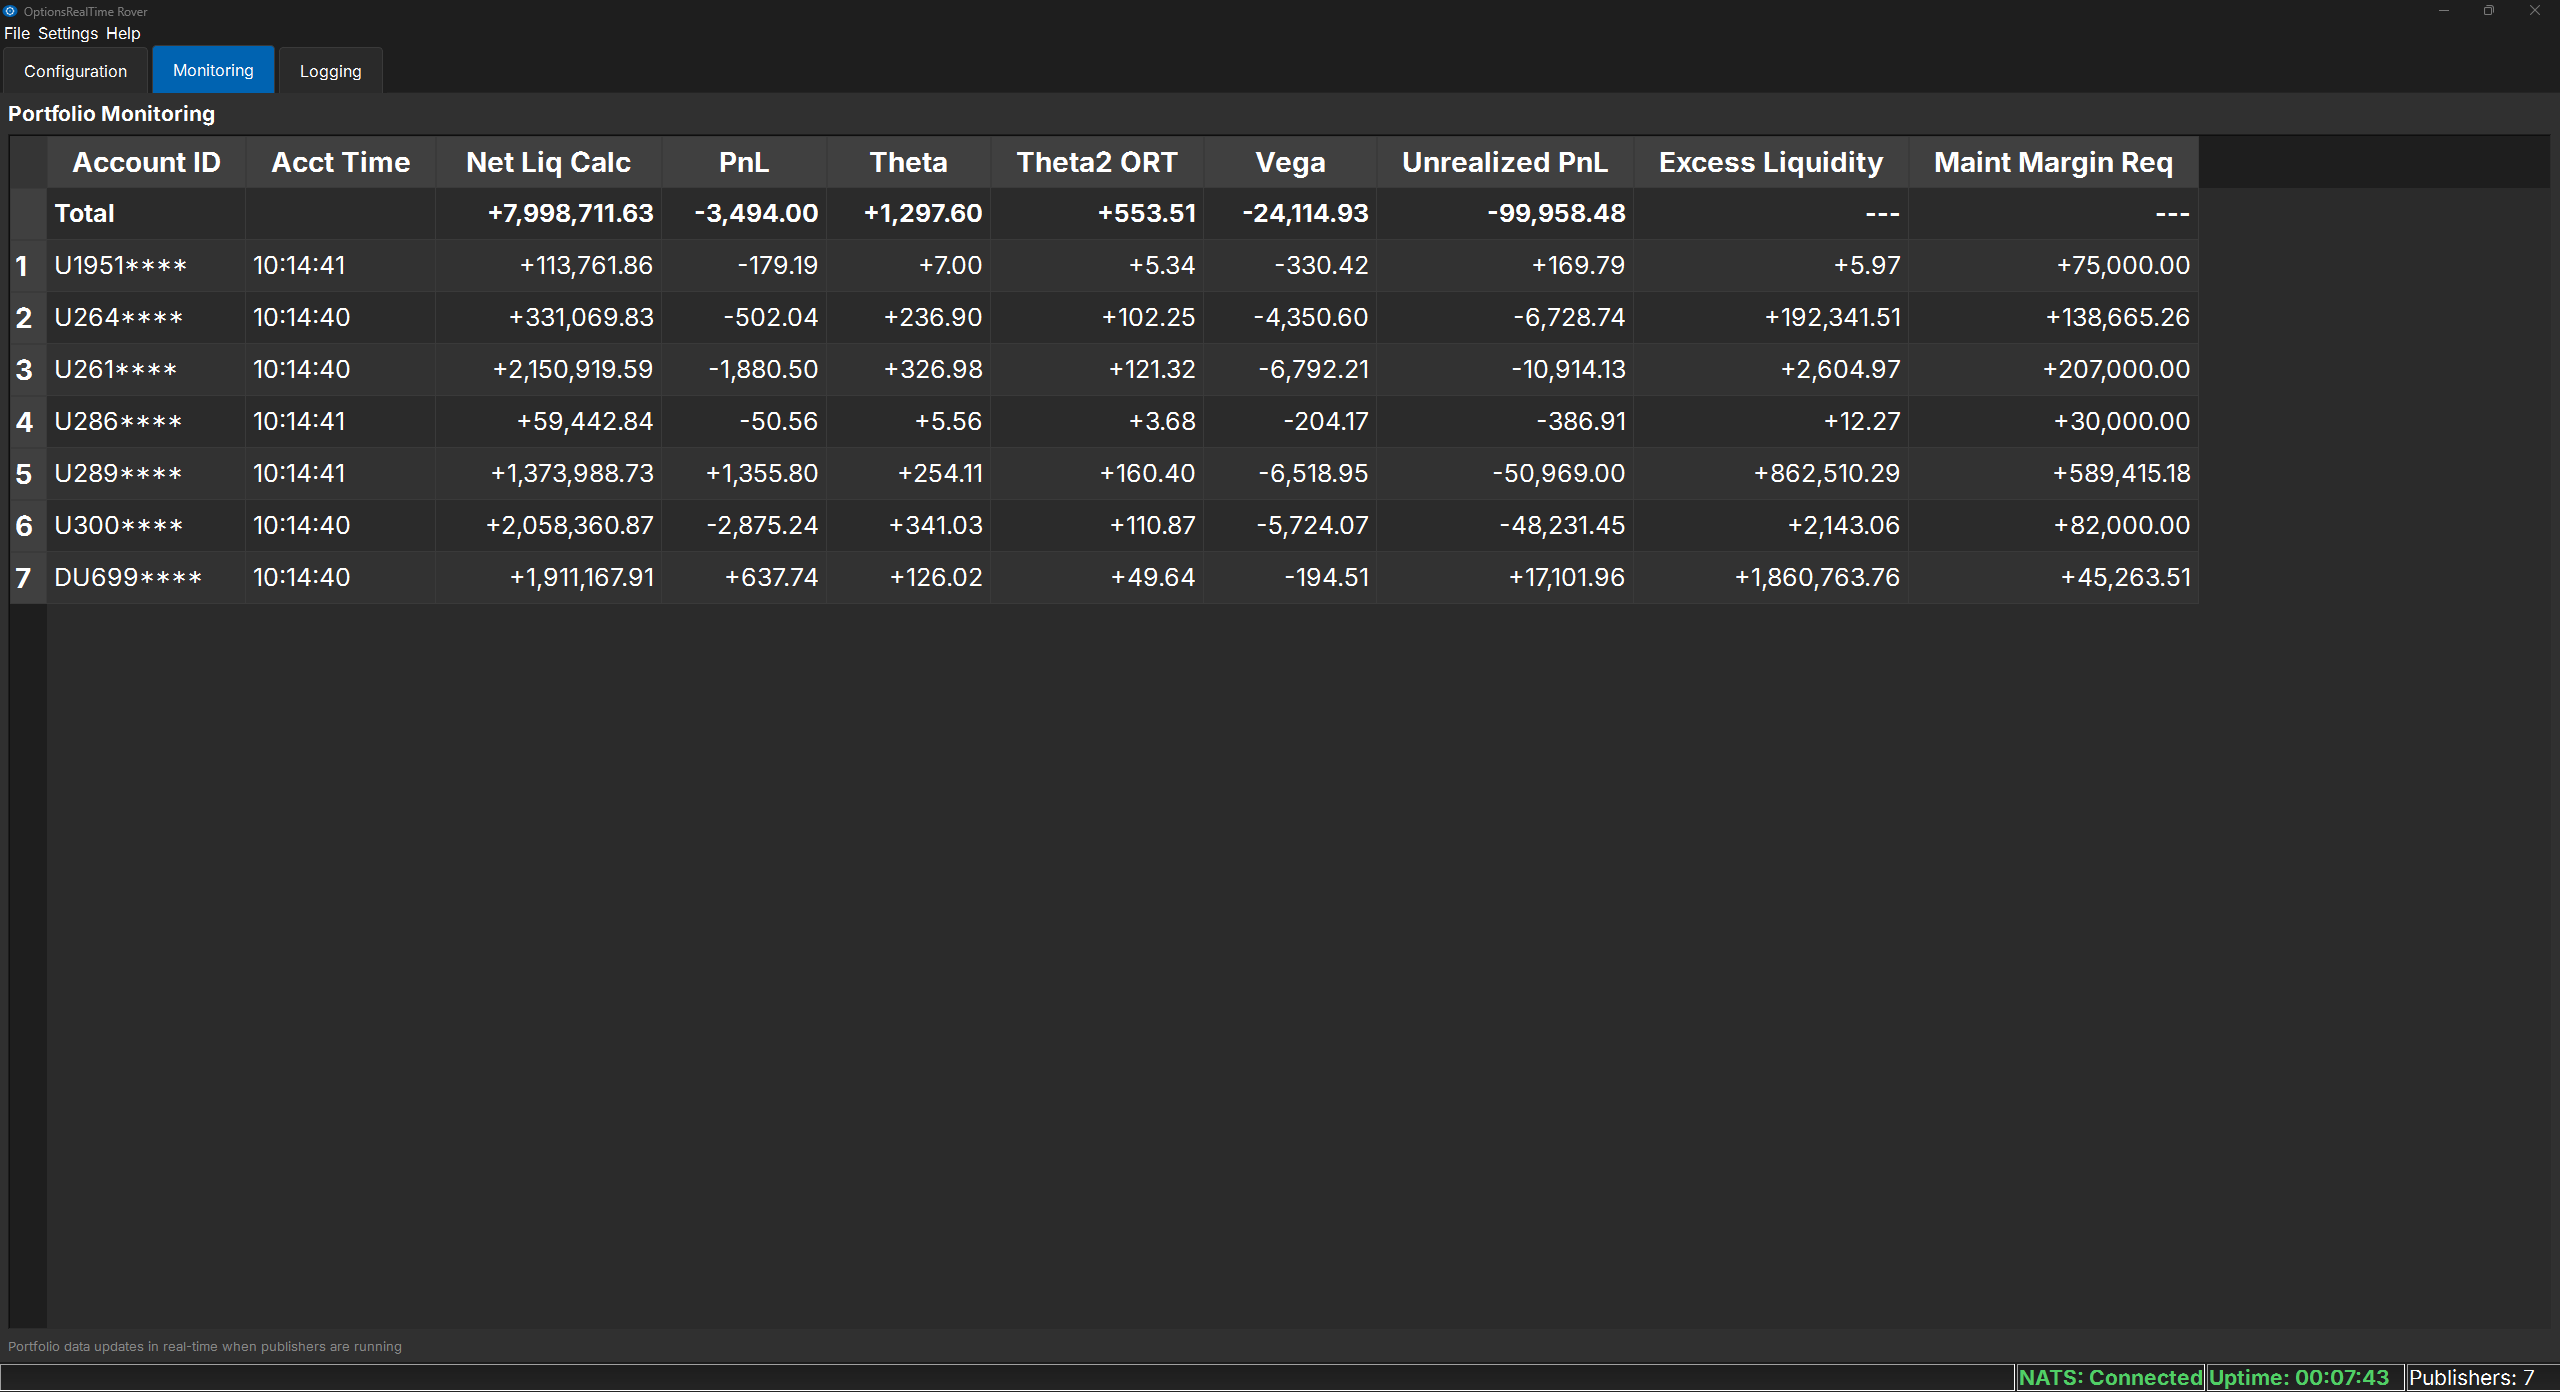
The Monitoring tab provides a live dashboard of portfolio metrics across all connected accounts. Each row displays key values for one account, with a Total row at the top aggregating values across all accounts.
Configuring Columns
Section titled “Configuring Columns”Click the Configure Columns button on the Monitoring tab to customize which metrics appear in the table. The column selector offers over 100 portfolio-level fields including:
- Value metrics: Net Liquidation, Gross Position Value, Option Market Value
- PnL metrics: Daily PnL, Unrealized PnL, PnL by instrument type
- Greeks: Delta, Gamma, Theta, Vega, and their variants (calls/puts, long/short)
- Margin: Initial and Maintenance margin requirements, Excess Liquidity
- Notional exposure: Notional values broken down by calls, puts, long, and short
- Extrinsic/Intrinsic: Time value and intrinsic value decomposition
Use the filter box to quickly find specific fields, or check Select All to display everything. Changes apply immediately. Account IDs can be masked or obfuscated for privacy when sharing screens or taking screenshots (see Account ID Privacy under Settings).
Throughput Columns (Developer Tool)
Section titled “Throughput Columns (Developer Tool)”Enable Show throughput columns in Settings → Developer Tools to add real-time throughput metrics to each row of the connections table:
- Bytes Security: instantaneous bytes received for the Security table (the largest data table)
- Bytes/Sec Security: rolling bytes per second
- Throughput: a visual bar chart showing throughput as a percentage of the configured baseline
- Acct Time: the account time reported by the TWS instance, confirming live data flow
Restart Buttons (Developer Tool)
Section titled “Restart Buttons (Developer Tool)”Enable Show Restart buttons in Settings → Developer Tools to add Test and Reboot controls to each row of the connections table:
- Test: verifies connectivity to a specific TWS instance
- Reboot: restarts an individual analyzer if needed
Logging Console (Developer Tool)
Section titled “Logging Console (Developer Tool)”Enable Show Configuration logs pane in Settings → Developer Tools to add an integrated logging console below the connections table. Use the tabs to switch between the main Rover log and individual analyzer logs (one per account), making it easy to isolate issues with a specific TWS connection. The console supports:
- Auto-scroll: automatically follows new entries as they appear
- Tab selection: switch between Rover and individual analyzer logs
- Log level filtering: filter by Debug, Info, Warn, Error, or Critical
The console follows the active log file, so entries appear as they are written.
File Menu
Section titled “File Menu”- Load Config: load a previously saved configuration file
- Load Installation Config: reset to the factory default configuration
- Save (Ctrl+S): save the current configuration
- License…: view and manage your license (see below)
- Exit: gracefully stop all analyzers and close Rover
License Management
Section titled “License Management”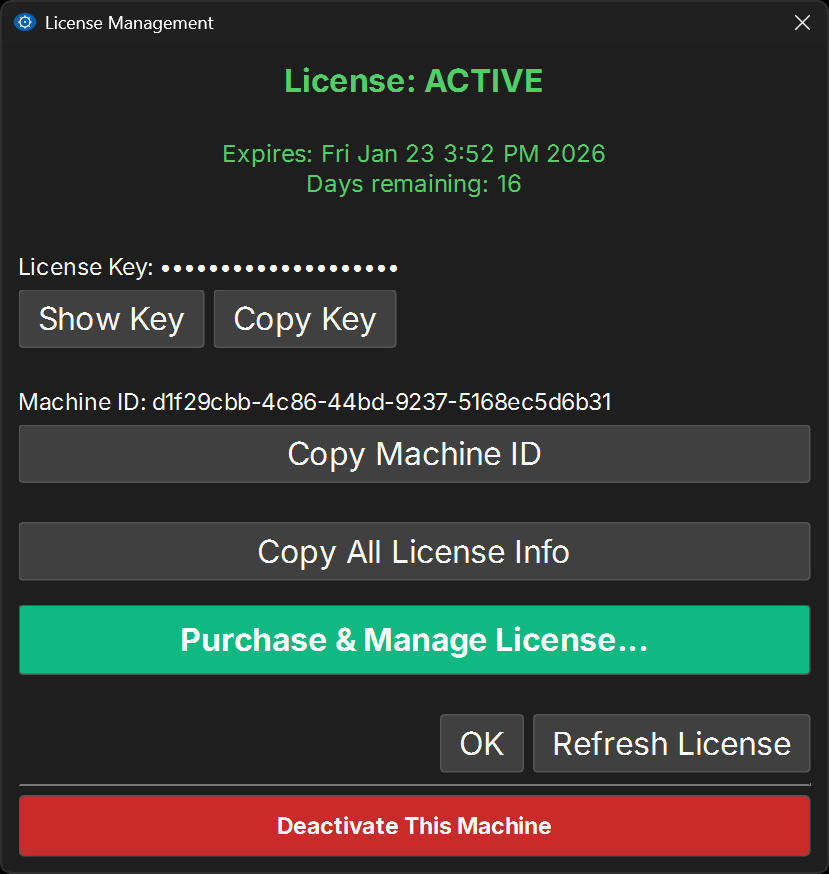
The License Management dialog displays the current license status, including expiration date and days remaining. From here:
- View or copy the license key
- Copy the Machine ID (required for license activation)
- Access the license portal to purchase or manage licenses
- Refresh license status after renewal
- Deactivate this machine (to transfer a license to another computer)