Expiry Profile Chart
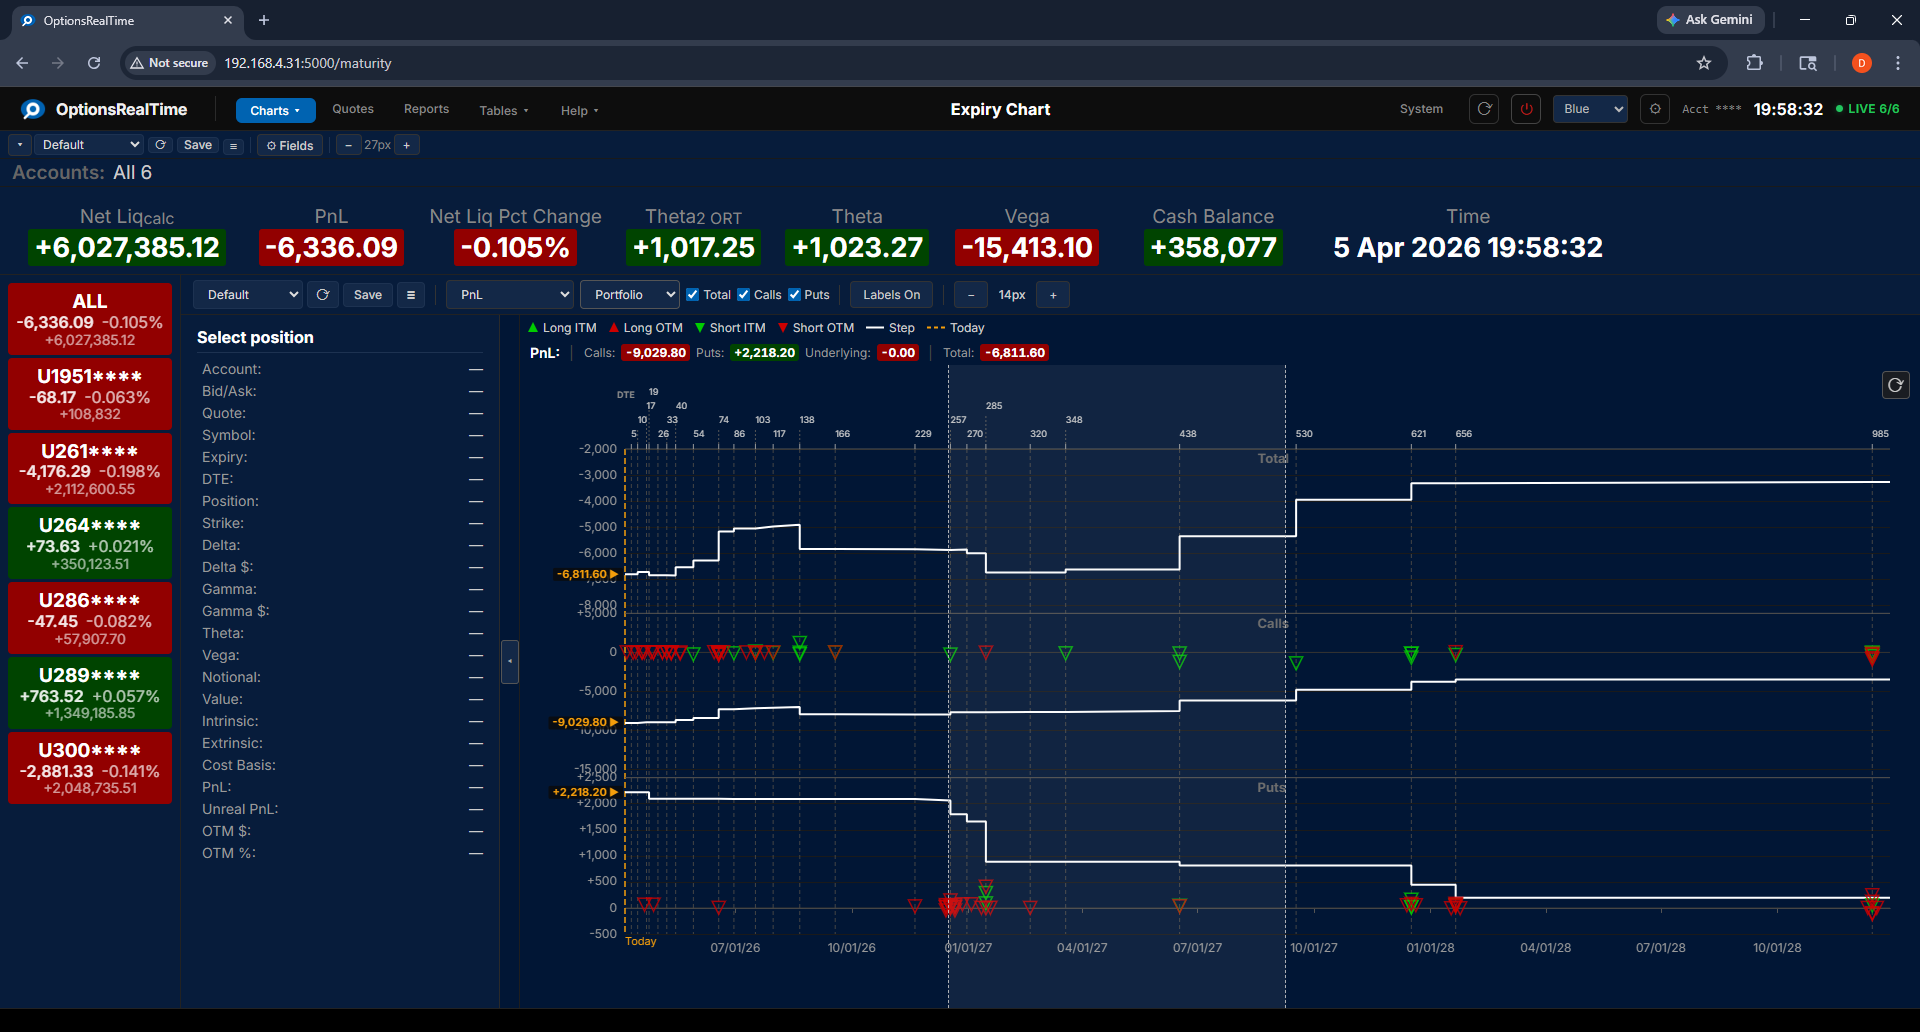
The Expiry Profile Chart shows how a selected metric is distributed across expiration dates. Three step charts display Total, Calls, and Puts values over time, showing how portfolio exposure evolves through upcoming expirations.
The top axis shows days to expiry and the bottom axis shows expiration dates. Position markers distinguish four types: Long ITM (in the money), Long OTM (out of the money), Short ITM, and Short OTM. A “Today” marker indicates the current date.
Toolbar
Section titled “Toolbar”- View selector: switch between named configurations
- Save Expiry Profile View: save the current configuration
- View Actions (hamburger menu): Reload, Save As, Rename, and Delete the current view (Rename and Delete are unavailable for the Default view)
- Metric: select from available metrics including PnL, Delta$, Theta, Vega, Value, Notional, Cost Basis, Intrinsic/Extrinsic Value, and Unrealized PnL
- Total: toggle visibility of the Total chart
- Calls: toggle visibility of the Calls chart
- Puts: toggle visibility of the Puts chart
- Labels On: toggle value labels on the chart
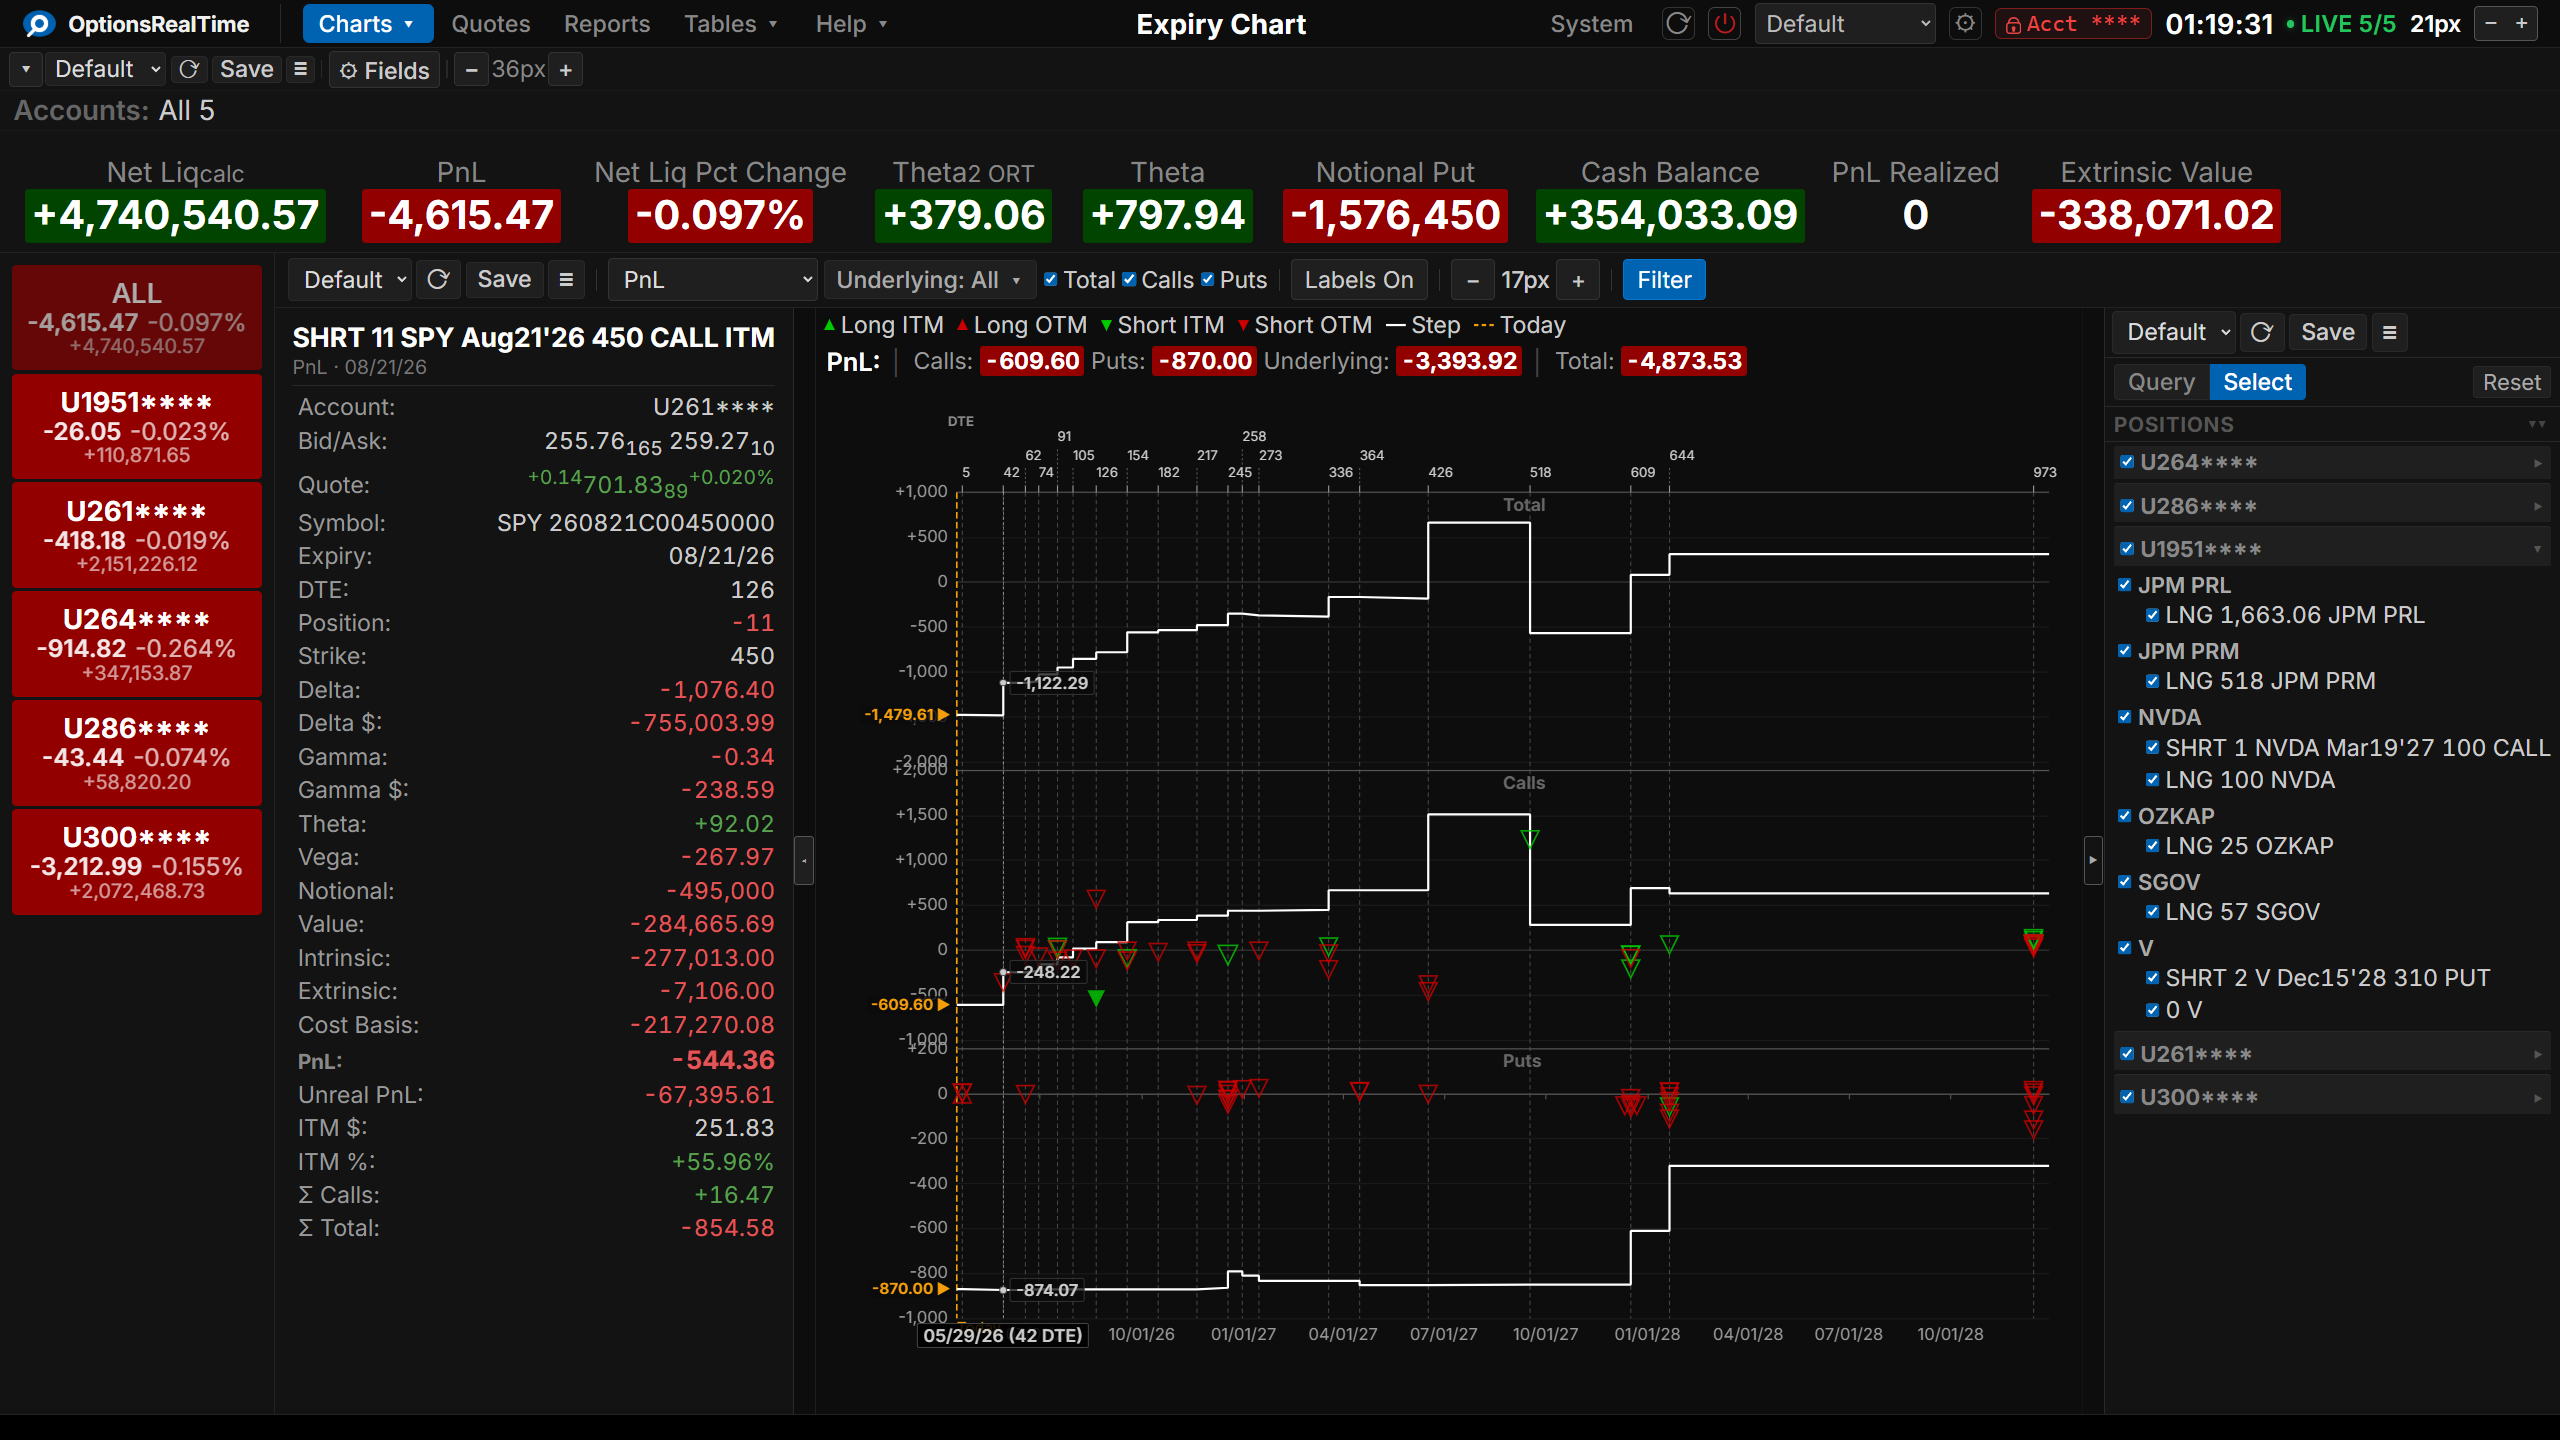
- Filter: toggle the Position Filter panel on the right side of the component
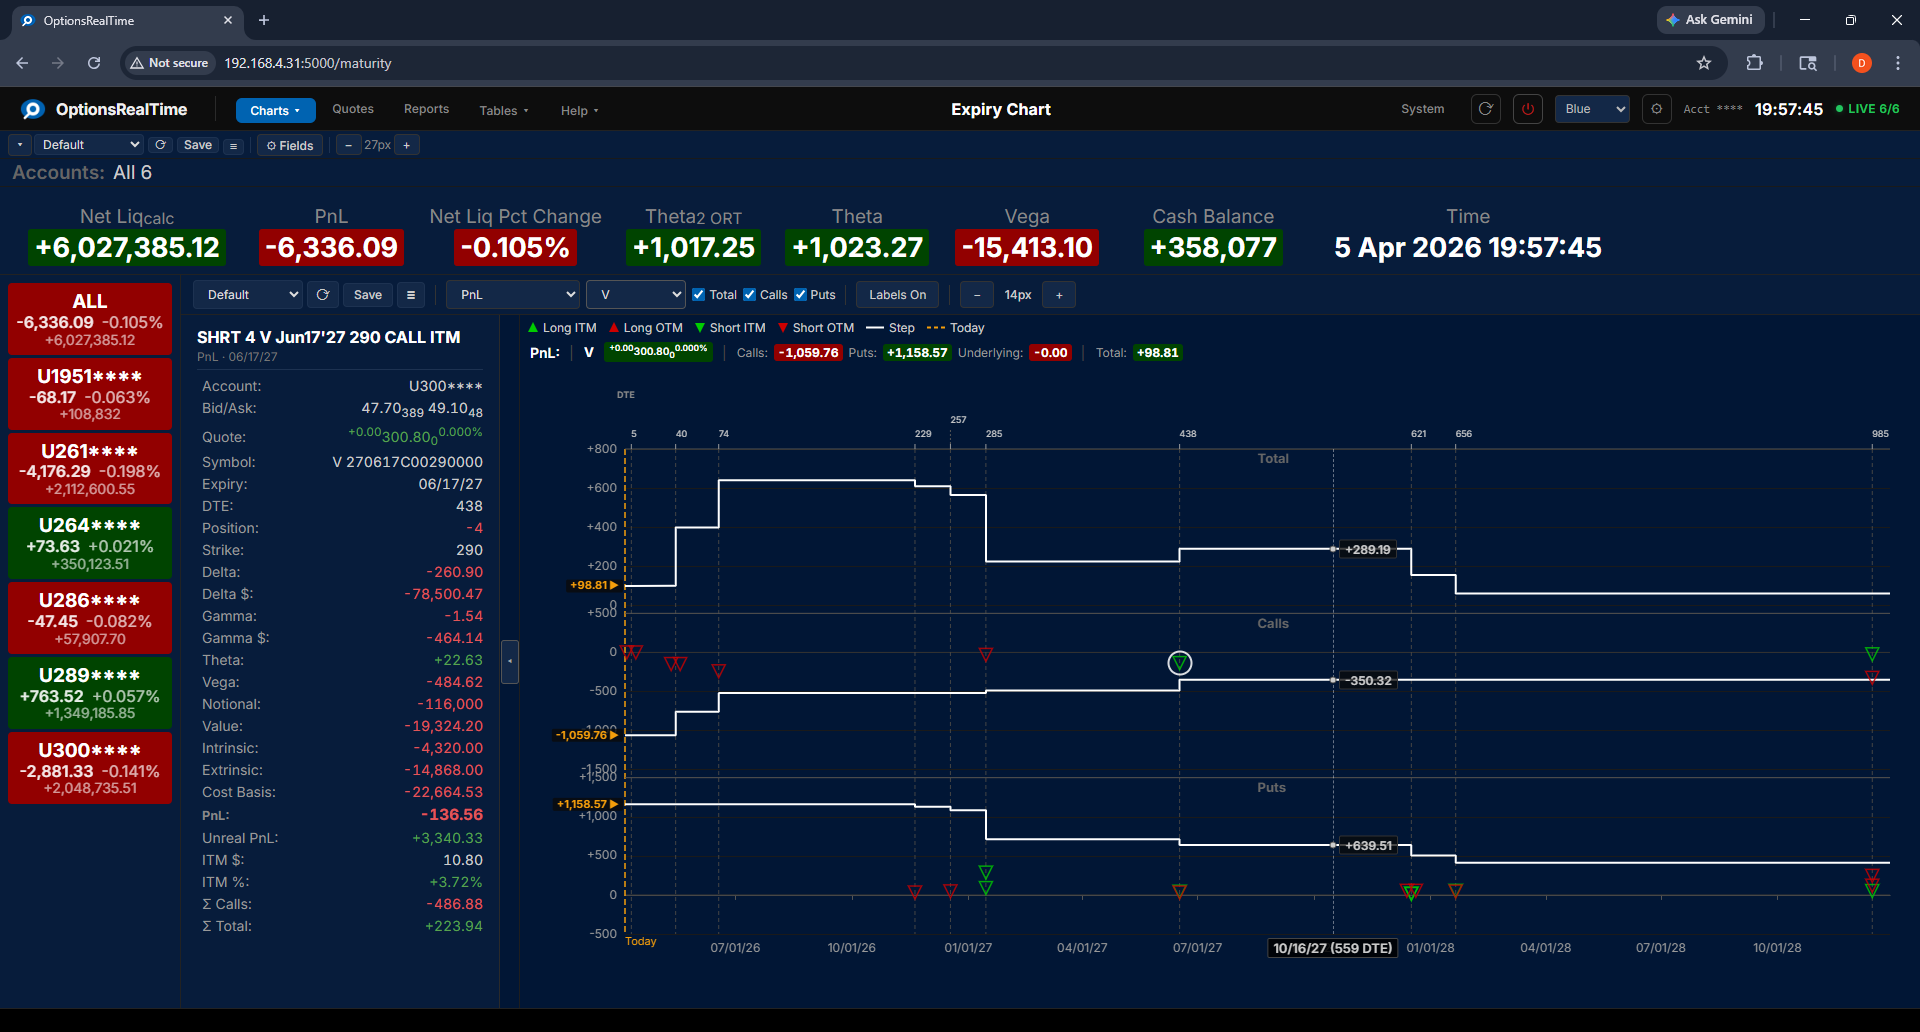
Visa selected as underlying:
Position Filter
Section titled “Position Filter”This component supports the Position Filter, a right-side panel that narrows the view to a chosen subset of positions. A filter selector narrows the selection by any combination of underlyings, type, side, or expiry, which can then be refined in the panel.
Vol Scenario
Section titled “Vol Scenario”The Vol Scenario toolbar switches between live IBKR market data and analytical what-if modeling:
- IBKR: live market values from IBKR
- Mkt: model using current market implied volatility
- Mkt-5%, Mkt-2%, Mkt+2%, Mkt+5%: model after adding or subtracting 2 or 5 percentage points to the implied volatility solved for, across all options
- IV10%, IV25%, IV50%, IV75%: model using scenario implied volatility levels
Side Panel
Section titled “Side Panel”The side panel can be opened by clicking the expand/contract tab in the center-left edge of the chart. It displays details for the selected position, including Greeks, PnL, Value, Intrinsic/Extrinsic, Cost Basis, ITM/OTM amounts, and more.
Clicking any position marker on the chart selects that position and displays its details in the side panel.
Chart Interaction
Section titled “Chart Interaction”- Mousewheel: zoom in and out
- Left-click drag: draw two vertical lines marking a zoom window; release to zoom to that range
- Right-click drag: pan left, right, up, and down
- Double-click: revert to default view
- Reset Zoom button (upper left, next to Filter): revert to default view