Account Exposure Chart
The Account Exposure chart provides two views of the same data:
- Account view: select an account to see the chosen metric for each of its underlyings
- Underlying view: select an underlying to see the chosen metric across each of its accounts
The picture below shows account view in base currency mode. The USD BASE button is on, the Metric list is open, and every underlying in every currency is on the chart. See Base Currency Mode.
Account view: stacked, base currency mode
Toolbar
Section titled “Toolbar”- View selector: switch between named configurations
- Save Account Exposure View: save the current configuration
- View Actions (hamburger menu): Reload, Save As, Rename, and Delete the current view (Rename and Delete are unavailable for the Default view)
- Account / Underlying toggle: switch between account view and underlying view
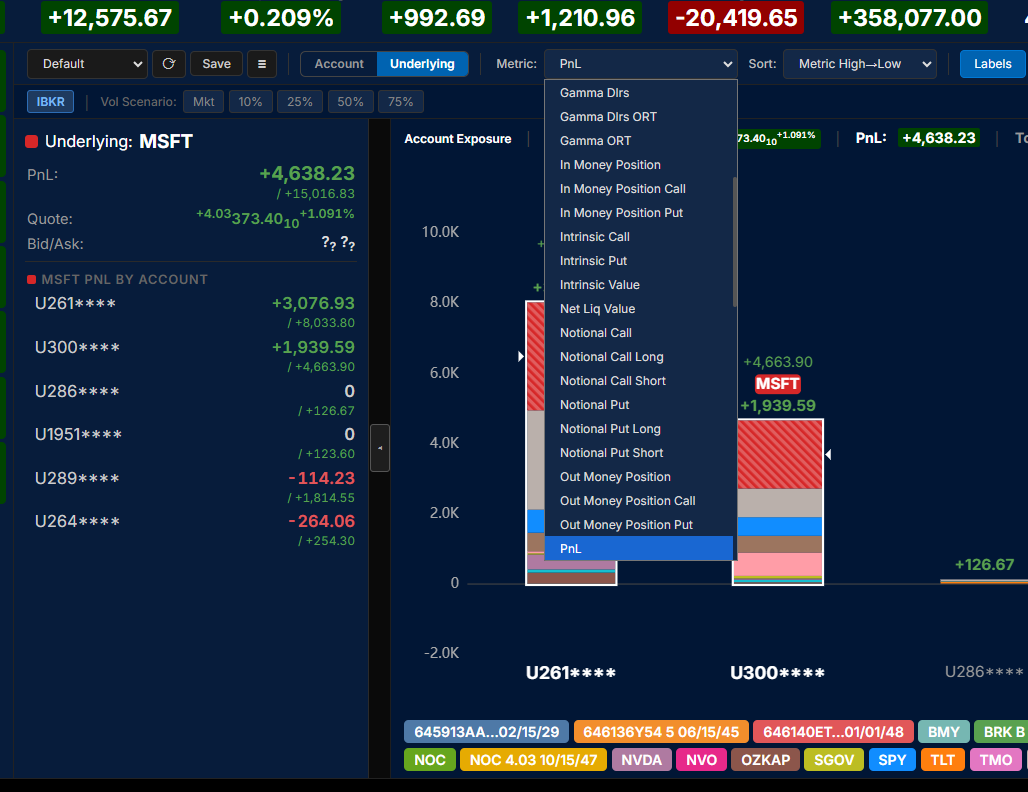
- Metric: select from available metrics including PnL, Greeks, Value, and Notional. In base currency mode the list holds six base-currency metrics instead
- USD BASE: switch the chart into base currency mode. The label shows the account’s base currency. See Base Currency Mode
- Sort: sort bars by metric value (High to Low or Low to High), by name (A to Z or Z to A), or by net liquidation value (High to Low or Low to High)
- Labels On: toggle value labels on each bar
- % NL: display values as a percentage of net liquidation
- Stacked / Grouped: toggle between stacked bars and grouped bars (side by side)
- Filter: toggle the Position Filter panel on the right side of the component
Position Filter
Section titled “Position Filter”This component supports the Position Filter, a right-side panel that narrows the view to a chosen subset of positions. Its selection controls narrow the choice by any combination of underlyings, type, side, or expiry, which can then be refined in the panel.
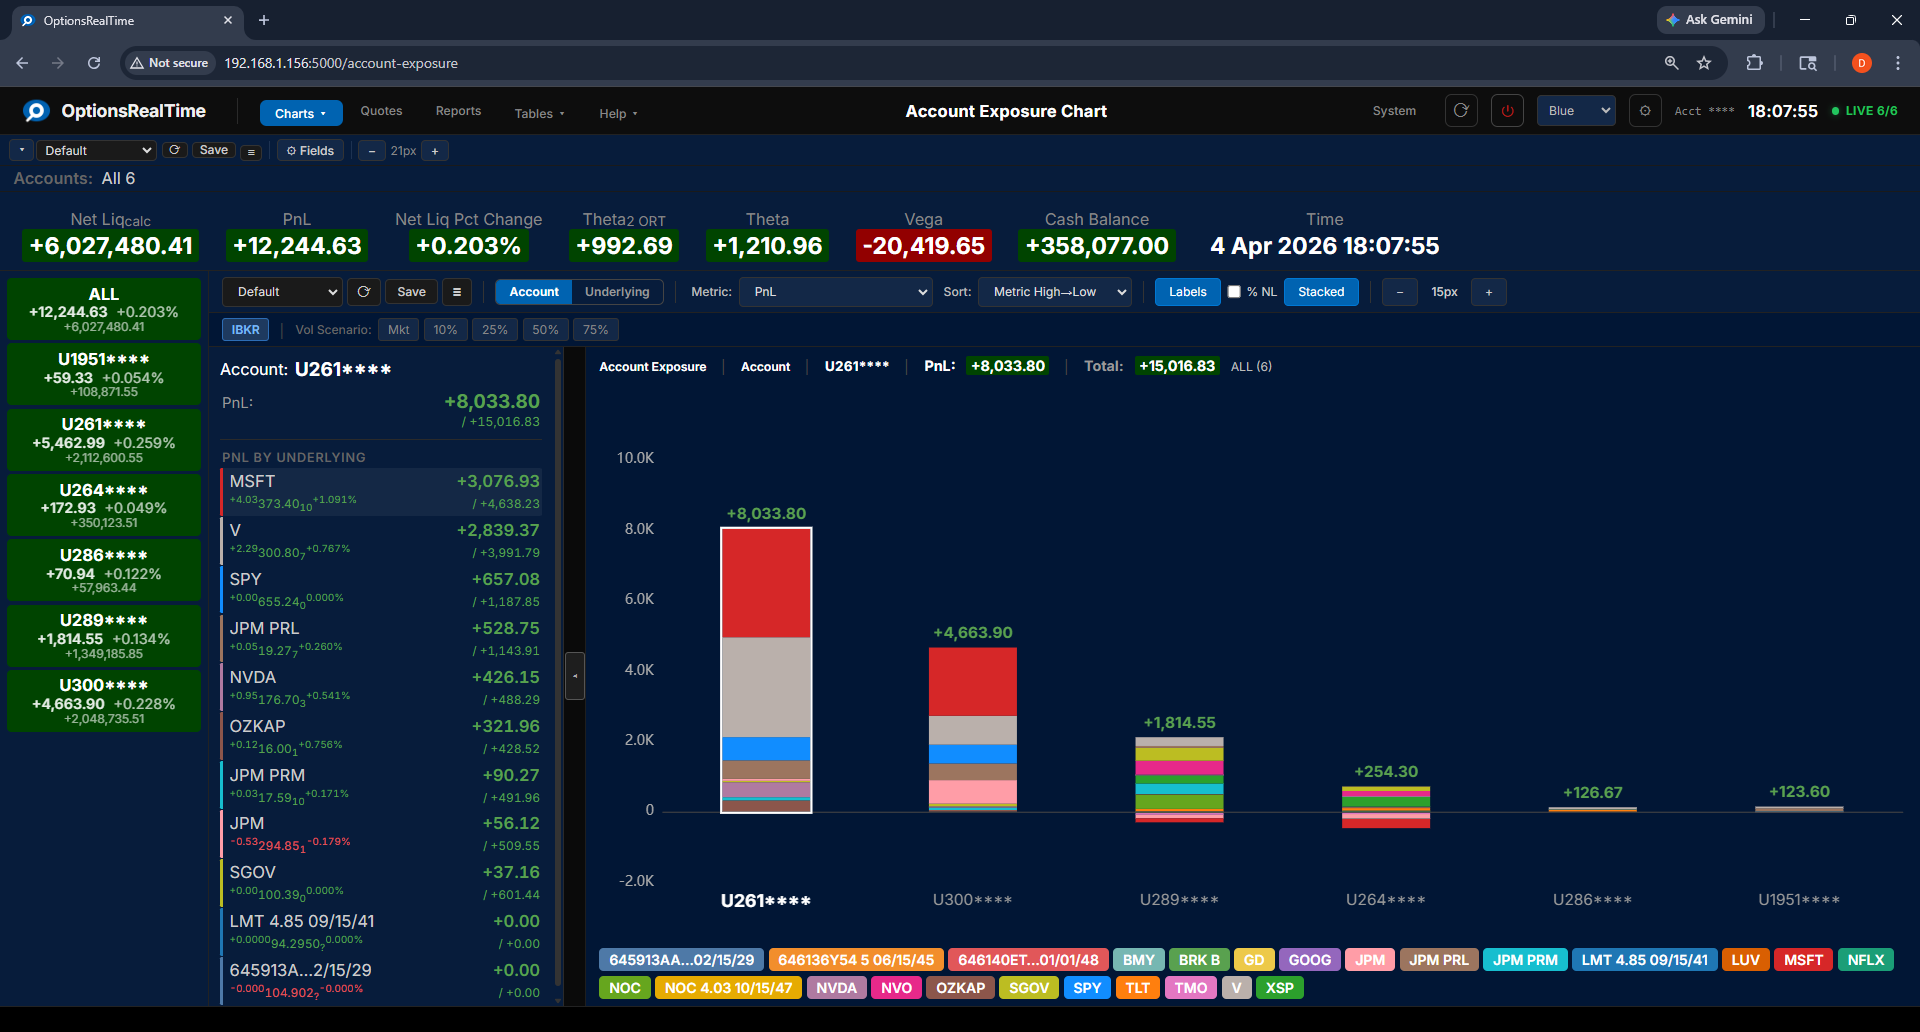
Account View
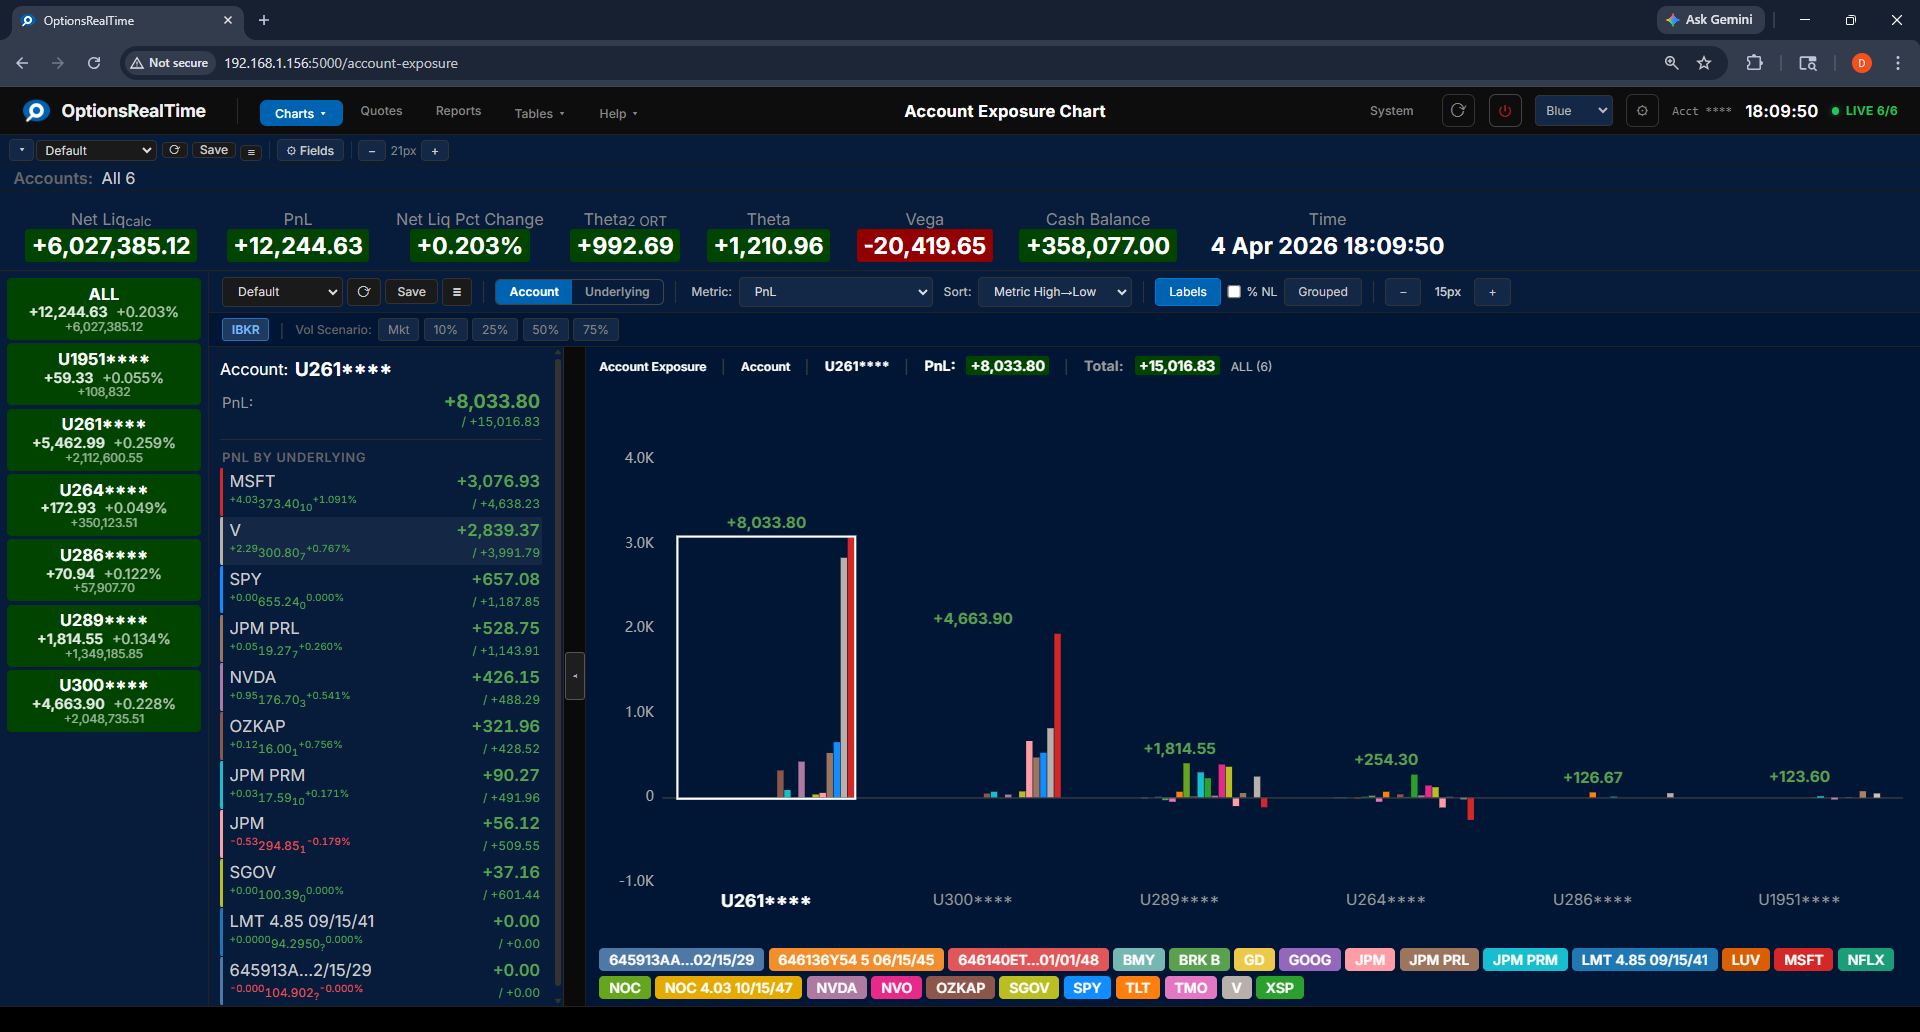
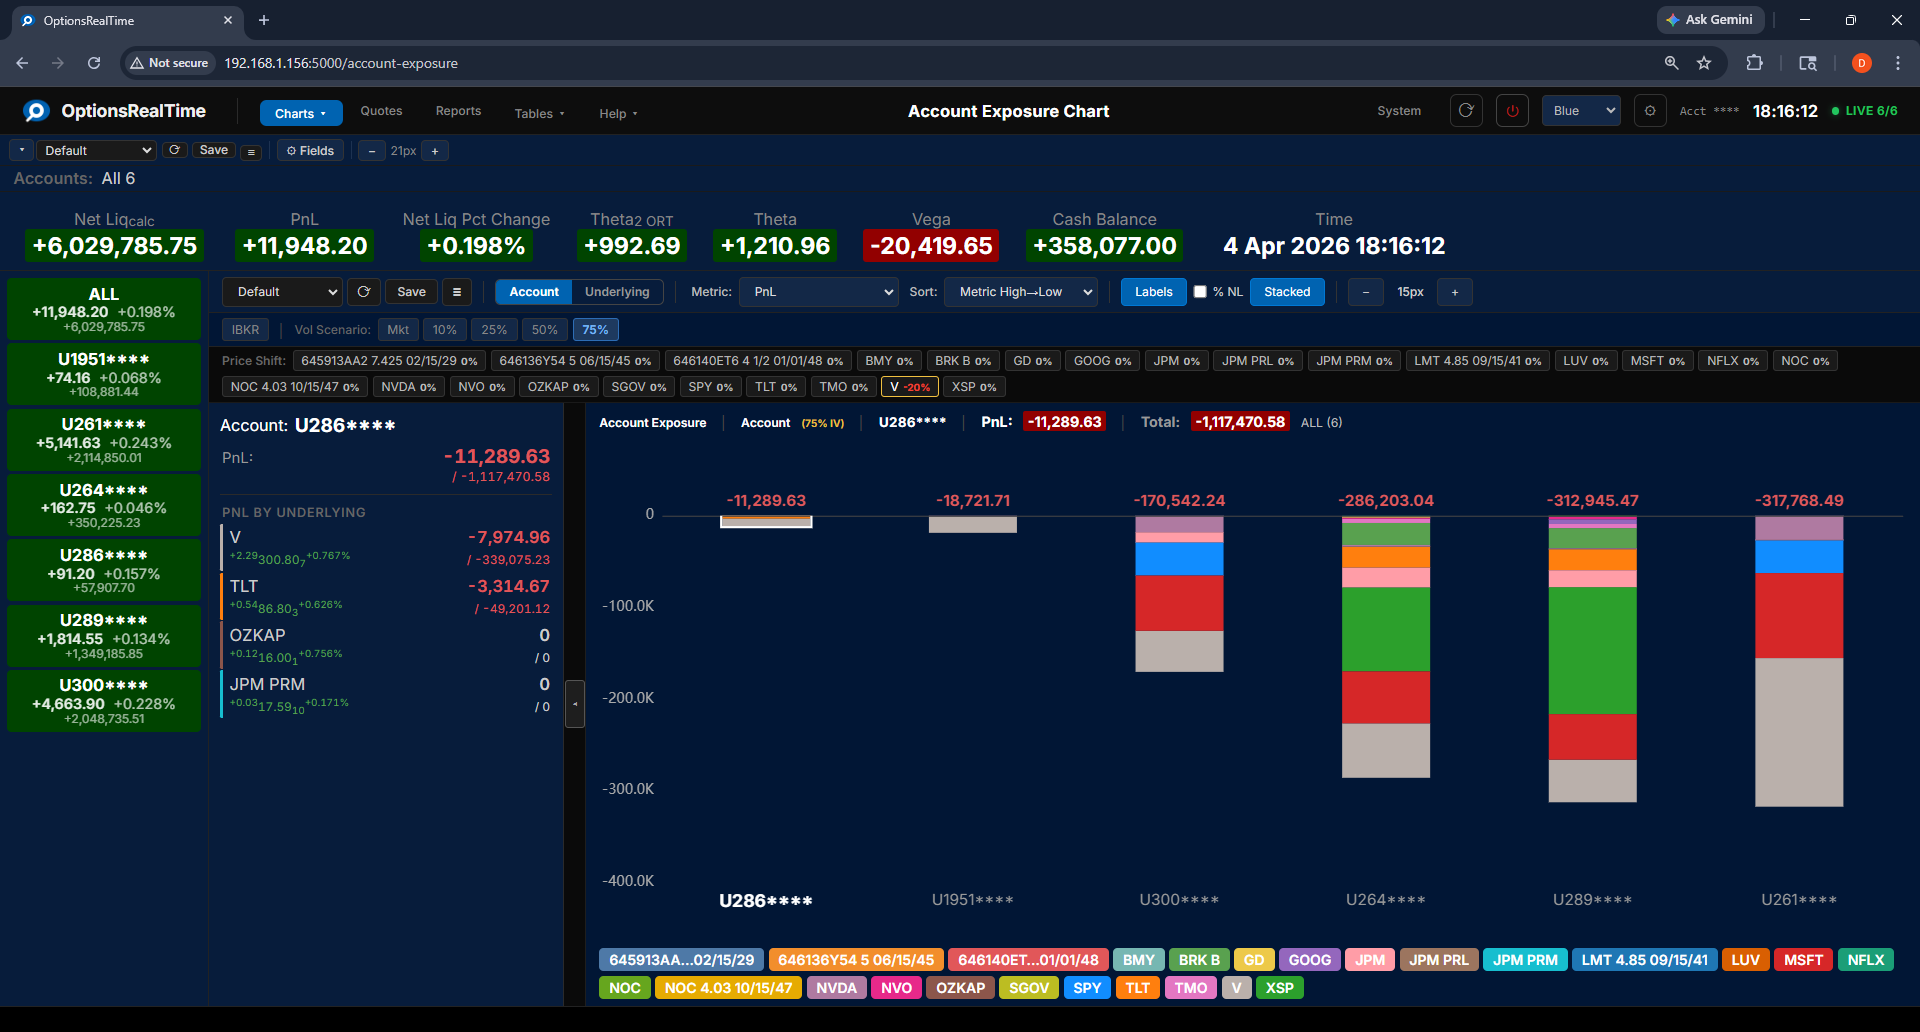
Section titled “Account View”In account view, each bar represents an underlying held by the selected account, color-coded by underlying. The chart header displays the selected account, the metric’s value for that account, and the total across all accounts.
Account view: grouped
Underlying View
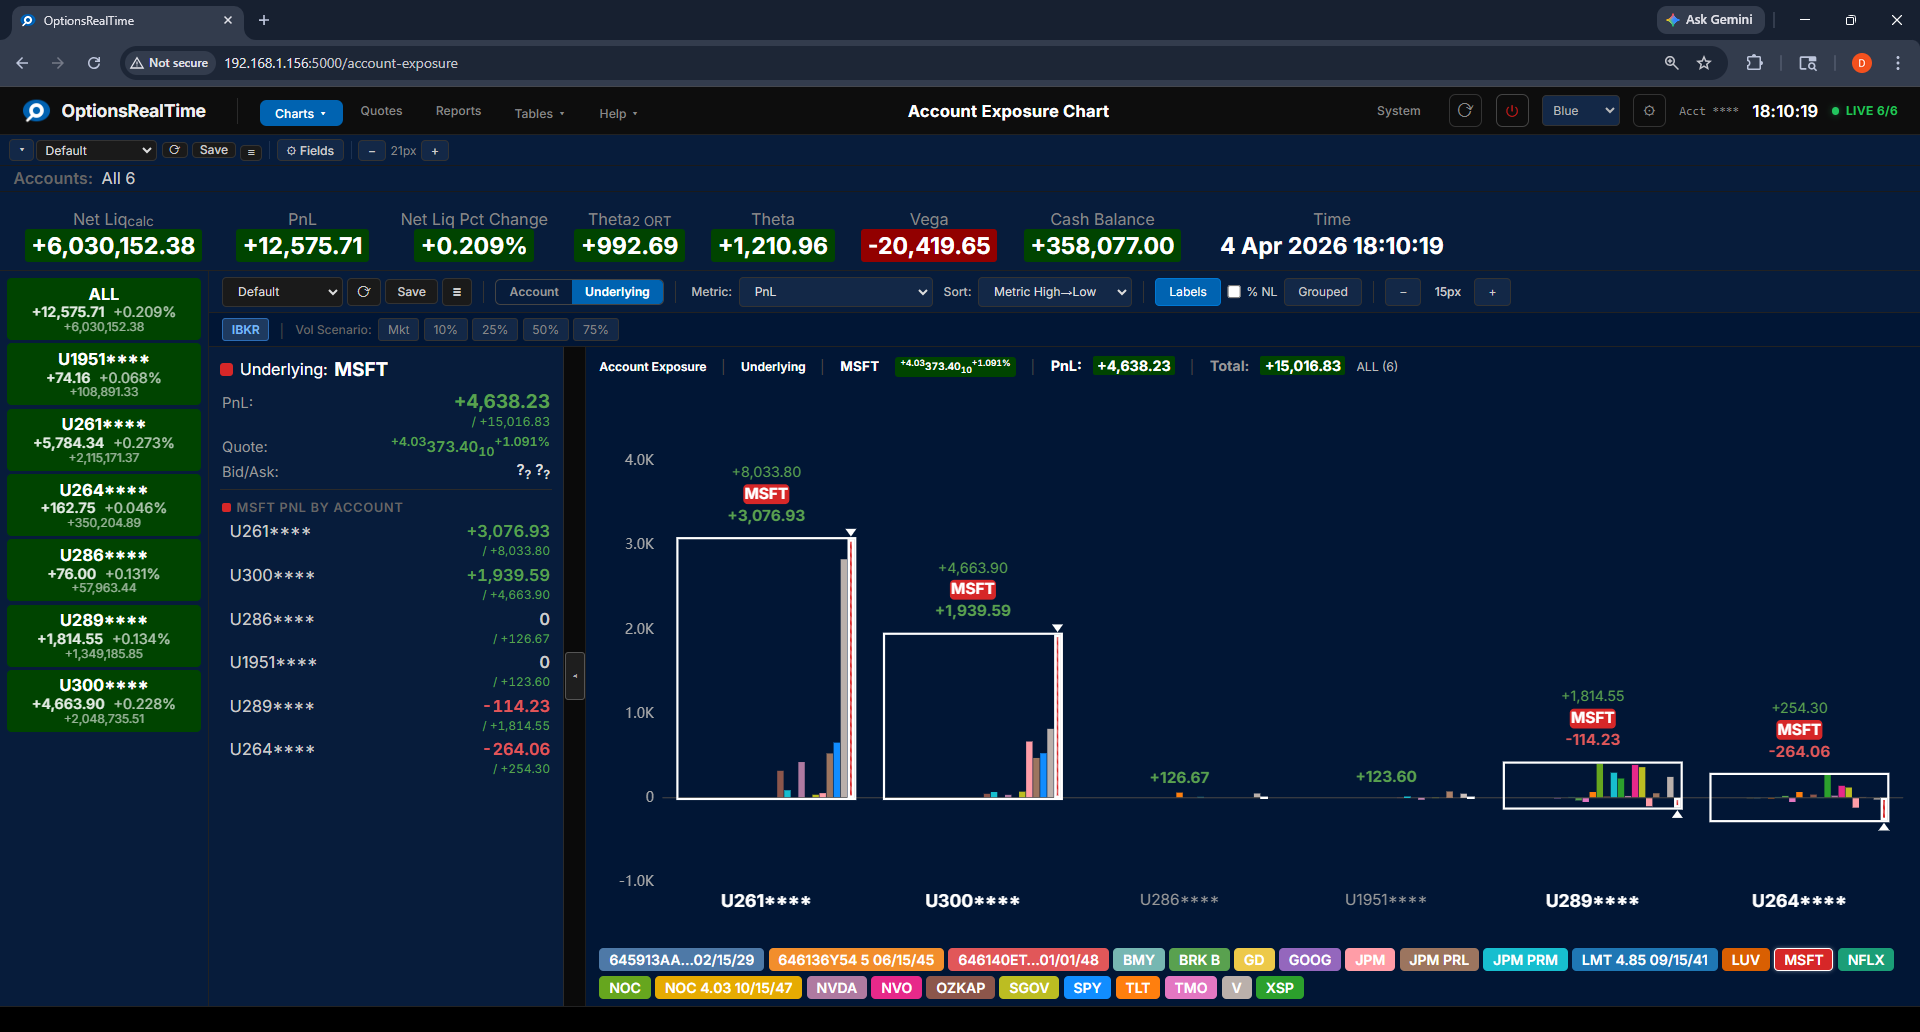
Section titled “Underlying View”In underlying view, each bar represents an account that holds the selected underlying, color-coded by underlying. The selected underlying is highlighted with cross-hatching across all account bars. The chart header displays the total of the metric across all accounts. In stacked mode, the metric value for just the selected underlying is shown next to the arrows on the left side of the chart.
Color-coded underlying buttons run along the bottom of the chart in both views. Clicking any button switches to underlying view with that underlying selected.
Underlying view: stacked

Underlying view: grouped
Side Panel
Section titled “Side Panel”The side panel can be opened by clicking the expand/contract tab in the center-left edge of the chart.
In account view, the side panel lists all underlyings for the selected account with their metric values. Clicking an underlying in the panel switches to underlying view with that underlying highlighted and all its accounts displayed.
In underlying view, the side panel lists all accounts holding the selected underlying with their metric values. Clicking an account in the panel switches to account view with that account highlighted and all its underlyings displayed.
Metrics
Section titled “Metrics”Select any metric from the dropdown to update the chart.
Base Currency Mode
Section titled “Base Currency Mode”The USD BASE button sits to the right of the Metric selector. It switches the chart into base currency mode. The label shows the base currency of the account, so a GBP account shows GBP BASE. The button turns blue when base currency mode is on. Base currency mode works in account view and in underlying view.
Base currency mode changes four things:
- The chart shows every underlying in every currency. A CAD stock and a EUR futures option appear beside the USD positions, and the underlying buttons along the bottom of the chart include them. Outside base currency mode the chart shows the underlyings of one currency at a time.
- Values are converted to the base currency. Each position’s value is multiplied by the IBKR exchange rate for its currency. The rate for the base currency itself is 1.00. The bars, the labels, the header value, and the header total are all in the base currency.
- The Metric list holds six base-currency metrics. PnL, Theta, Theta ORT, Theta2 ORT, Vega, and Vega ORT. Each name carries the base code, for example USD BASE Theta. These are the
PNL_POSITIONS_BASE,THETA_BASE,THETA_ORT_BASE,THETA2_ORT_BASE,VEGA_BASE, andVEGA_ORT_BASEfields in the field reference. - The currency selector is locked. The currency selector at the top left shows the base code and cannot be changed while base currency mode is on.
Other rules:
- The Vol Scenario buttons are greyed out in base currency mode. ORT computes scenario values only in each position’s own currency, so there is no base-currency scenario value to plot.
- Turning base currency mode on clears the Position Filter. Every position in every currency becomes selected. Example: you select only SU in the CAD view, then turn base currency mode on. SU is no longer the only selected position. Select SU again if you want it alone.
- Turning base currency mode off puts the currency selector back to the currency you had selected before you turned it on.
- Base currency mode is saved with the view.
- Base currency mode assumes every account in the login has the same base currency. If two accounts have different base currencies, the totals are wrong.
Vol Scenario
Section titled “Vol Scenario”The Vol Scenario toolbar switches between live IBKR market data and analytical what-if modeling. The toolbar is greyed out in base currency mode.
- IBKR: live market values from IBKR
- Mkt: current market implied volatility
- Mkt-5%, Mkt-2%, Mkt+2%, Mkt+5%: model after adding or subtracting 2 or 5 percentage points to the implied volatility solved for, across all options
- IV10%, IV25%, IV50%, IV75%: scenario implied volatility levels
When a Vol Scenario is active, a Price Shift row appears showing every underlying with its current price adjustment. Any number of underlyings can be adjusted from -20% to +20%. The chart updates to show the projected metric value under both the IV scenario and the price moves.
Account view
Underlying view

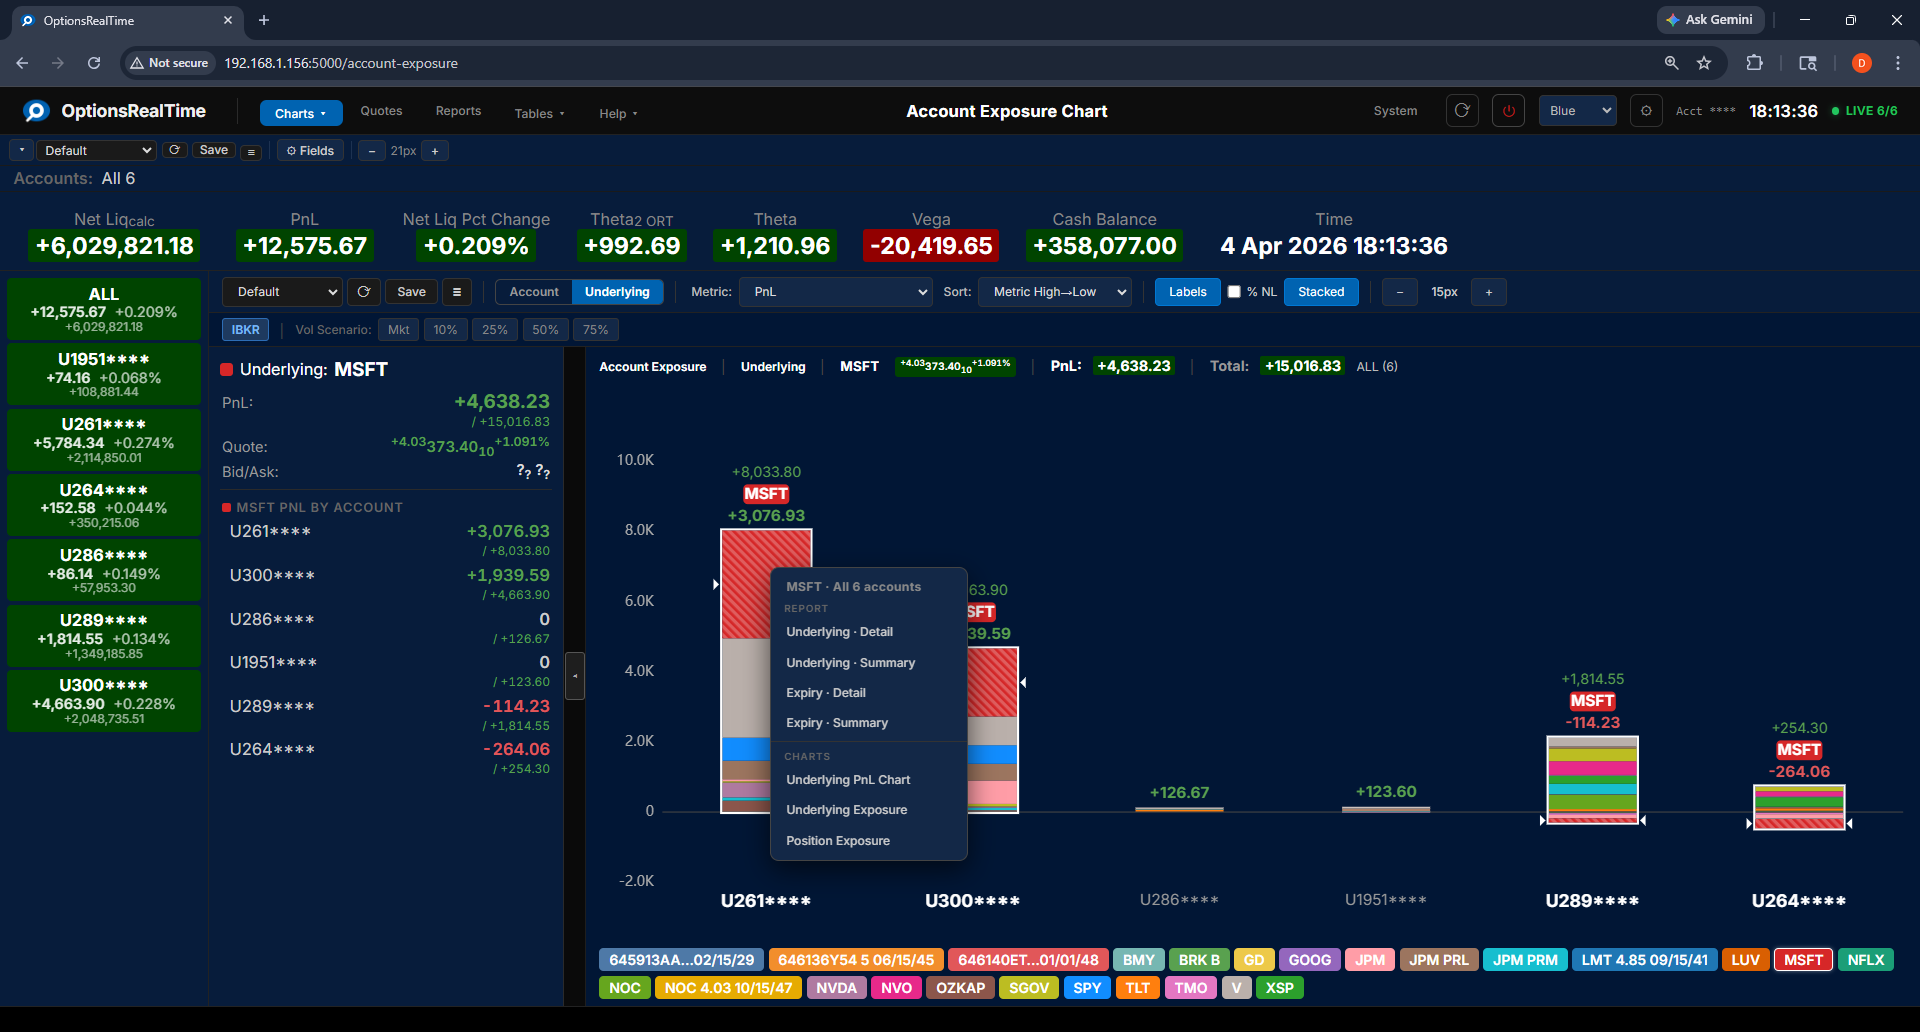
Right-Click Navigation
Section titled “Right-Click Navigation”Right-clicking opens a context menu with links to related reports and charts for the selected accounts in the account selector. In underlying view, right-clicking a bar or the side panel navigates to that underlying. In account view with stacked bars, right-clicking a bar attempts to resolve the underlying at the click position. Right-click navigation is not available in account view with grouped bars: right-click an underlying in the side panel to bring up its context menu.