
Delta Profile Chart
The Delta Profile chart takes the positions you have selected for an underlying, chosen in the Position Filter, and categorizes each by its single-option delta. Each bar is a delta bucket, and its height is the selected metric for that bucket. When more than one position falls in the same bucket, the bar is stacked, with one segment per position. Segments are colorized by the annualized yield of extrinsic value, and a color bar on the left edge maps the yield scale. Values are summed across the accounts you have selected.
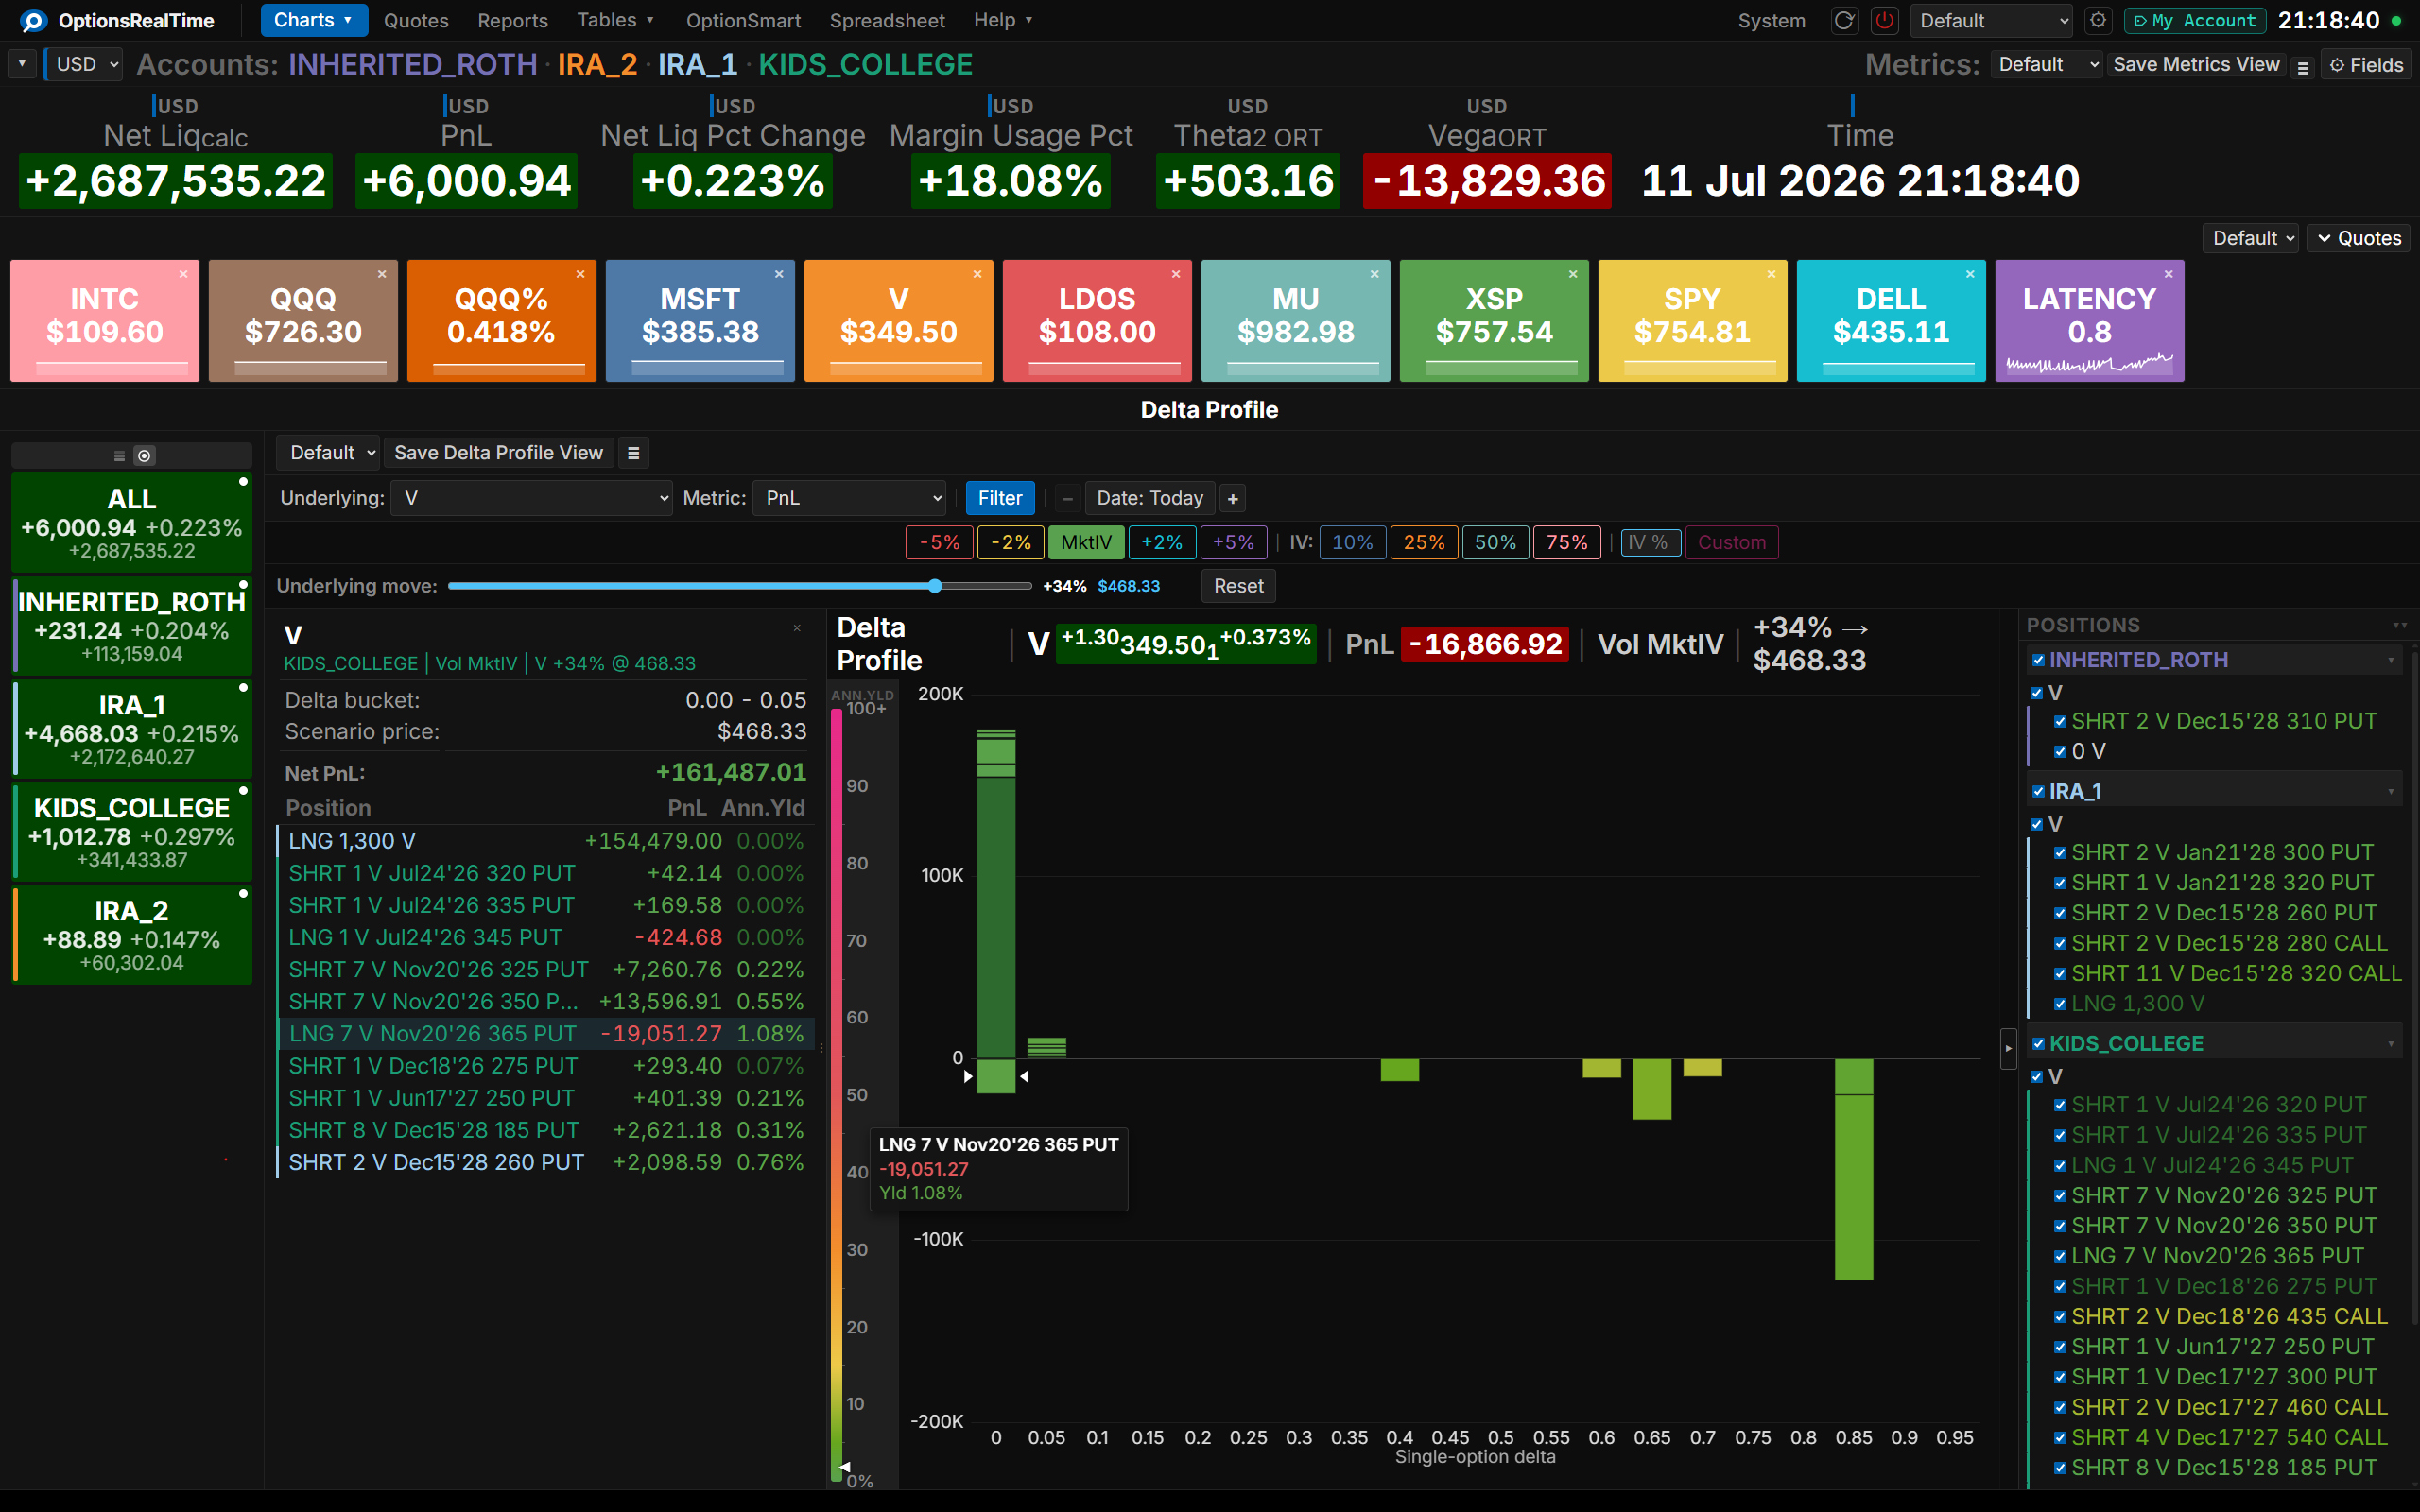
The chart header displays the selected underlying, its price and percent change, the selected metric and its total across every position in the chart, the volatility in effect, and the scenario move with its resulting price. The horizontal axis is single-option delta, from 0 to 1, in buckets 0.05 wide. The bucket is the absolute value of the option’s own single-option (per-contract) delta, so its sign and whether the position is long or short do not matter. A long put with a delta of -0.30 sits in the same bucket as a long call with a delta of +0.30. A position’s place along the axis is therefore its moneyness. Single-option delta approximates the probability the option finishes in the money, so 0 on the left is an option effectively certain to expire out of the money and 1 on the right one effectively certain to expire in the money. The vertical axis shows the selected metric.
Within a bucket, positive contributions stack upward from zero and negative contributions stack downward, so a bucket holding both shows its long and short sides separately rather than only the net.
The chart prices the position under three inputs: the date to evaluate, an underlying move, and a volatility. Together they answer “how is my risk distributed across delta, priced at this date, this price, and this volatility.” Every input can be changed, and the chart recomputes immediately.
Toolbar
Section titled “Toolbar”- View selector: switch between saved configurations
- Save Delta Profile View: save the current setup
- View Actions (hamburger menu): Reload, Save As, Rename, and Delete the current view. Rename and Delete are not available for the Default view.
- Underlying: pick which underlying to display
- Metric: pick the metric to chart. The choices are Delta Dlrs ORT, Delta ORT, Extrinsic Value, Gamma Dlrs ORT, Gamma ORT, PnL, PnL Unrealized, Theta Linear, Theta ORT, Theta2 ORT, Value ORT, and Vega ORT.
- Filter: show or hide the Position Filter panel on the right
- Date: pick the date to evaluate. See Date.
The Date control lists dates from today through the earliest expiration among the options in your filter. One date is evaluated at a time.
The - and + buttons on either side of the control step back and forward through the list one date at a time, so you can advance the date and watch the profile change. They are disabled at the ends of the list.
Two of the date choices are special:
- Expiry: the expiration date, priced as if one day is left, so some time value remains.
- EOD (settle): the end of the expiration date, with no time value left, which removes all extrinsic value.
This is the same Dates control used in Vol Scenario Custom mode.
Volatility
Section titled “Volatility”A single volatility is used to price the position. The chips match those in the Vol Scenario chart, in both name and color, and exactly one is active at a time:
- MktIV: each option priced at its own current market implied volatility
- -5%, -2%, +2%, +5%: the market implied volatility surface shifted by that amount. The shift is parallel, so the shape of the skew is preserved. These model the everyday moves in volatility that come with a scare or a rally, rather than replacing the surface outright.
- IV: 10%, 25%, 50%, 75%: fixed volatility levels, applied to every option
- Custom: a fixed volatility you type in
Underlying move
Section titled “Underlying move”The Underlying move slider applies a single price change to the underlying, from -50% to +50%. The scenario price appears next to the slider, and the chart reprices the whole position at that level.
Sweeping the slider is the point of the chart. As you drag it, each option’s delta changes, so its segment moves to a different bucket and its moneyness shifts. On the axis, which uses the absolute delta, calls march toward 1 as the underlying rises while puts retreat toward 0, and the reverse as it falls. The extrinsic-yield coloring reclassifies at the same time, because extrinsic value is richest at the money and thins out toward both tails. This lets you watch how moneyness and yield move across the book as the underlying rises or falls. The Reset button returns the slider to 0%.
Because the volatility input and the price move are set independently, raising volatility while sweeping the price models a combined price and volatility shock to the selected positions, and shows how their delta, moneyness, and extrinsic yield respond together. With PnL as the selected metric, the bar heights show how that shock lands on profit and loss, usually the number that matters most, and the header shows the total across every position in the chart.
Annualized yield of extrinsic value
Section titled “Annualized yield of extrinsic value”The color of each segment is the option’s annualized yield of extrinsic value: the extrinsic value remaining in the option, taken as a percent of its strike, and annualized over the days left to expiration. It is the same measure as IBKR’s Time Value % field, and it is not theta. Theta is the rate at which extrinsic value decays each day; this is the level of extrinsic value that remains.
The scale runs from deep green at 0% through green, yellow, orange, and red to magenta at 100% and above. Since extrinsic value peaks at the money, a position’s color tends to warm as it approaches the money and cool as it moves deep in or far out of the money.
Read together with the axis, the color adds a second dimension. Extrinsic yield is richest for at-the-money options and for higher implied volatilities, so a warm segment near the middle of the axis, at a delta around 0.5, is a near-at-the-money option holding rich time value. Those options carry the most gamma, so a cluster of warm color around the center shows where gamma risk concentrates in the book. Segments that stay cool toward either tail hold little extrinsic value and little gamma.
Position Filter
Section titled “Position Filter”This chart covers one underlying at a time. Positions can be selected in the Position Filter panel on the right, toggled with the Filter button in the toolbar. Each position in the filter list is tinted with its own extrinsic-yield color, using the same scale as the chart.
Side Panel
Section titled “Side Panel”The left panel shows the details for the selected delta bucket: the account, the volatility and underlying move in effect, the delta range of the bucket, the scenario price, and the net value of the metric for that bucket. Below that it lists each position in the bucket with its contribution to the metric and its annualized yield of extrinsic value. Clicking a position in this list selects it in the chart.
The panel’s net is for the selected bucket alone. The total across every position in the chart is in the header, next to the metric.
Chart Interaction
Section titled “Chart Interaction”- Left-click a bar: select a position in that bucket. The selection is marked in the chart and its details are shown in the side panel.
- Hover a segment: a readout appears with the position, its value, and its yield. The pointer on the color bar moves to that position’s yield.
- Left-click a position in the side panel: select that position’s segment in the chart.
- Right-click: open the menu