
Spreadsheet
The Spreadsheet is a live worksheet. ORT_* formulas read the Portfolio, Underlying, Position, and System table data for a given account, and the cell value updates as new data arrives. The function names, field names, and arguments match the Excel RTD add-in.
A workbook holds as many sheets as needed, and each is saved with the Spreadsheet View.
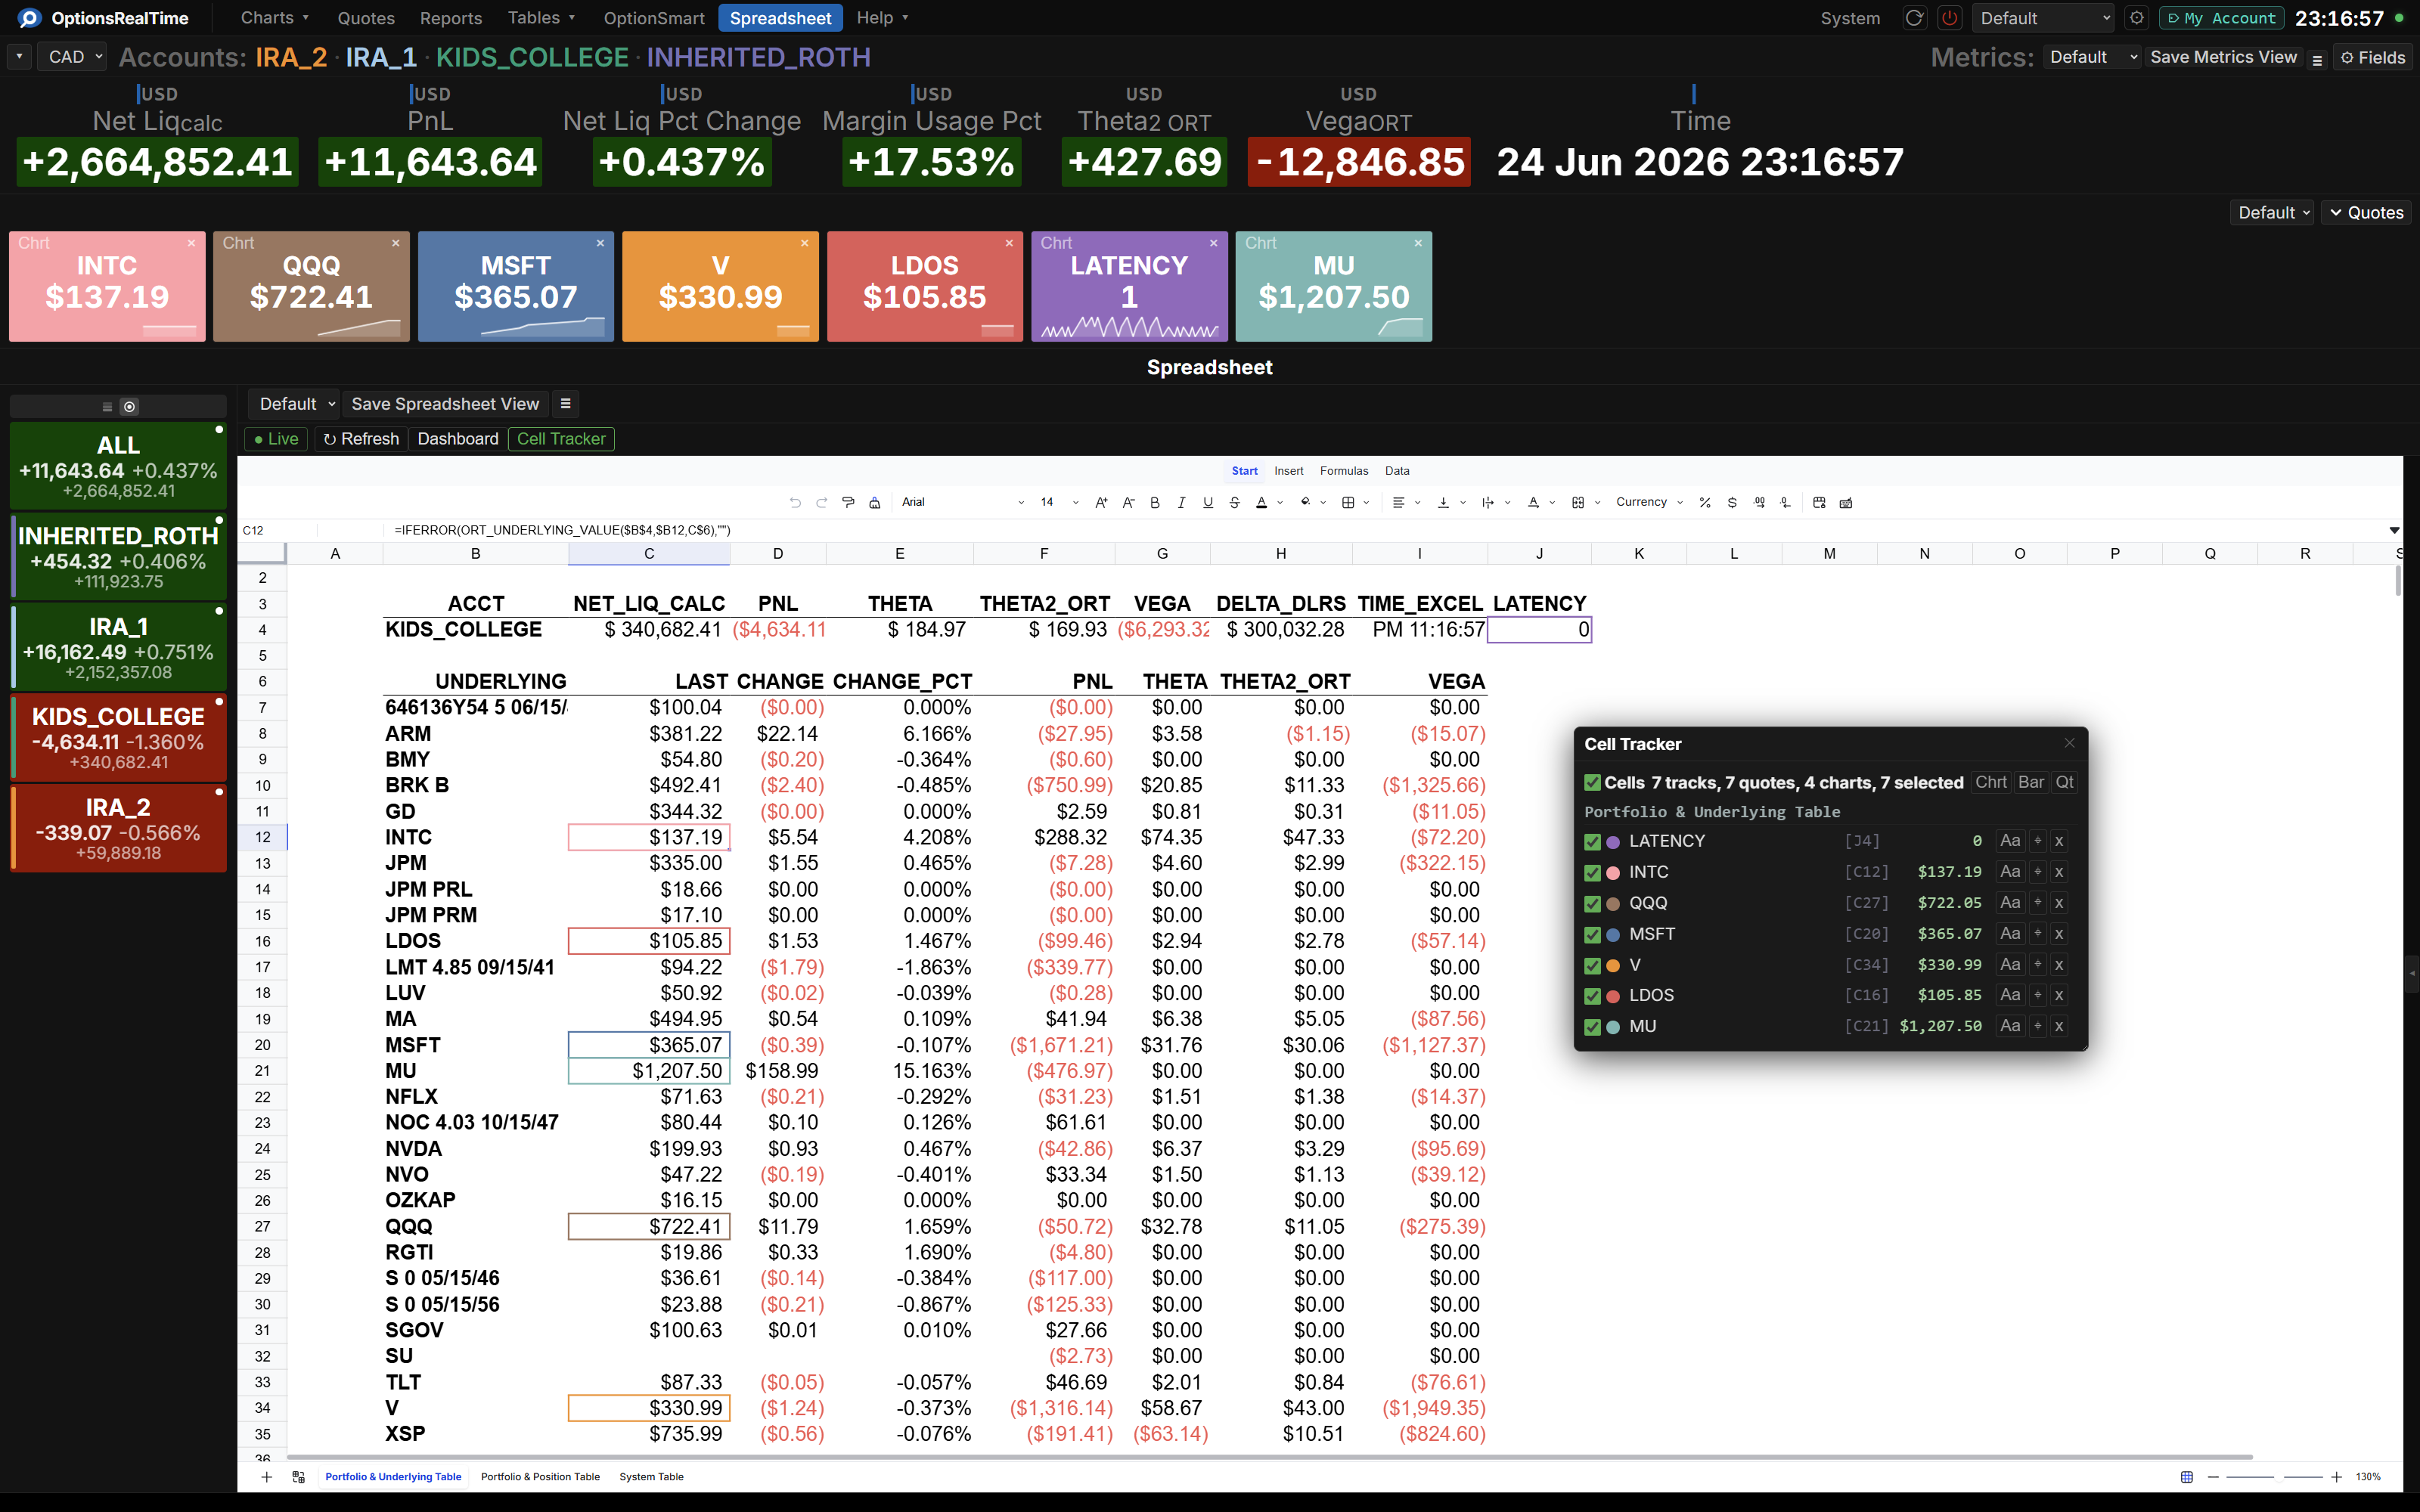
Toolbar
Section titled “Toolbar”- View selector: switch between named workbooks
- Save Spreadsheet View: save the current workbook
- View Actions (hamburger menu): Reload, Save As, Rename, and Delete the current view (Rename and Delete are unavailable for the Default view)
Live and Paused
Section titled “Live and Paused”A control above the sheet switches between Live and Paused.
- Live: cells recompute as new data arrives.
- Paused: nothing updates, which allows formulas to be edited without interruption. An Update now button appears alongside the control while paused and recomputes the sheet once each time it is pressed.
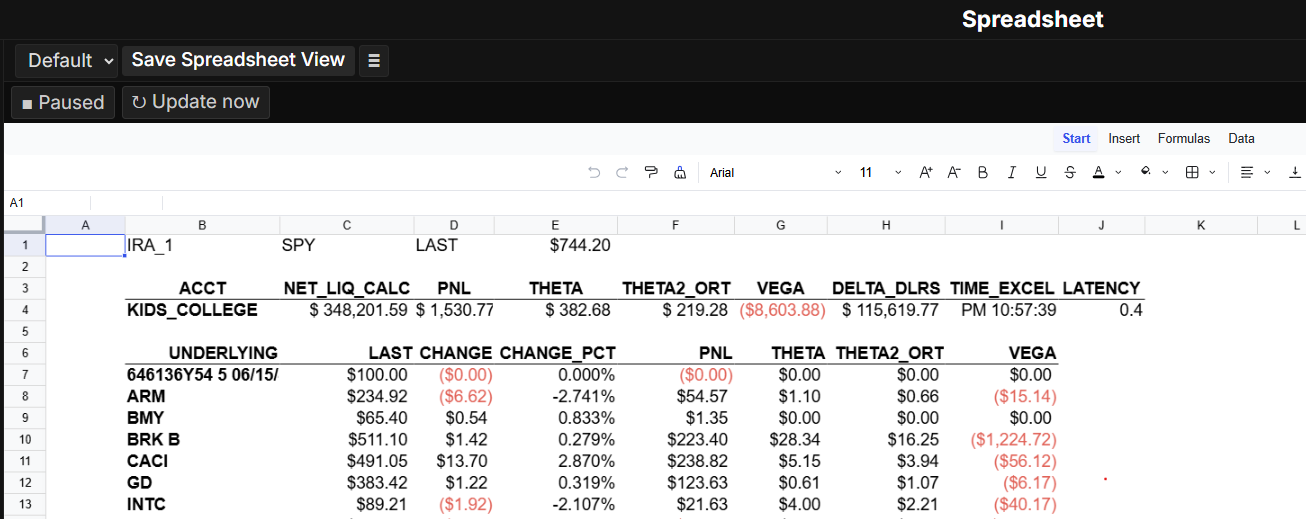
Switching back to Live resumes continuous updates and removes the Update now button.
ORT formulas
Section titled “ORT formulas”Type = in a cell and begin with ORT_ to see the list, or select a function from the OptionsRealTime group on the Formulas tab of the ribbon. Each function is a live read: the cell value updates as new data arrives, and only cells whose underlying data changed are recomputed.
A formula to confirm it is working:
=ORT_ACCOUNTS_SIZE()That returns the number of connected accounts. From there:
=ORT_SYSTEM_VALUE("U1234567", "SYSTEM_STATUS")Rules that apply to every function
Section titled “Rules that apply to every function”- Account argument - Accepts an account ID (
"U1234567") or an account name ("My IRA"), case-insensitive. - Field name - Accepts the wire name (
"NET_LIQUIDATION"), case-insensitive. Use the*_FIELD_ATfunctions to list the valid names for a table. - Indexes are 1-based - The first item is index
1, matching the Excel add-in. - conidOrSymbol - Where a function takes a contract, a number is treated as a contract ID and a string as a symbol (matched case-insensitively). When a symbol matches more than one contract, the lowest contract ID is used.
- Dynamic arrays - Functions spill. When an array is passed in, an array is returned:
=ORT_ACCOUNT_NAME_AT(SEQUENCE(ORT_ACCOUNTS_SIZE()))returns the full list of account names down a column. - Errors -
#N/Ameans the value is not available yet (an account not connected, a name that has not arrived).#VALUE!means an argument was invalid (an unknown field name, a non-numeric index).
Discovery pattern
Section titled “Discovery pattern”Each table exposes the same shape: a value accessor, row discovery (a count and an at-index lookup), and field discovery (a field count and an at-index name lookup). Pair a *_SIZE with the matching *_AT and SEQUENCE to list accounts, contracts, symbols, or field names dynamically.
Account
Section titled “Account”| Function | Returns |
|---|---|
ORT_ACCOUNTS_SIZE() | Number of connected accounts. |
ORT_ACCOUNT_AT(index) | Account ID at a 1-based index, sorted by ID. |
ORT_ACCOUNT_NAME_AT(index) | Account name at a 1-based index (same order). Returns the ID until the name arrives. |
ORT_ACCOUNT_NAME(account) | Account name for an account ID or name. |
ORT_ACCOUNT_ID(accountOrName) | Canonical account ID for an ID or name. |
System
Section titled “System”| Function | Returns |
|---|---|
ORT_SYSTEM_VALUE(account, fieldName) | System-table value for an account. |
ORT_SYSTEM_FIELDS_SIZE() | Number of System fields. |
ORT_SYSTEM_FIELD_AT(index) | System field name at a 1-based index. |
Portfolio
Section titled “Portfolio”The Portfolio value reads the account-level Total row (the base-currency aggregate).
| Function | Returns |
|---|---|
ORT_PORTFOLIO_VALUE(account, fieldName) | Account-level Portfolio value. |
ORT_PORTFOLIO_FIELDS_SIZE() | Number of Portfolio fields. |
ORT_PORTFOLIO_FIELD_AT(index) | Portfolio field name at a 1-based index. |
Position
Section titled “Position”One row per held contract.
| Function | Returns |
|---|---|
ORT_POSITION_VALUE(account, conidOrSymbol, fieldName) | Position value for a contract (number = contract ID, string = symbol). |
ORT_POSITION_CONIDS_SIZE(account) | Number of position rows for the account. |
ORT_POSITION_CONID_AT(account, index) | Contract ID at a 1-based index, ascending. |
ORT_POSITION_SYMBOLS_SIZE(account) | Number of distinct position symbols. |
ORT_POSITION_SYMBOL_AT(account, index) | Symbol at a 1-based index, alphabetical. |
ORT_POSITION_FIELDS_SIZE() | Number of position fields. |
ORT_POSITION_FIELD_AT(index) | Position field name at a 1-based index. |
Underlying
Section titled “Underlying”One row per underlying (the position rows summarized to the underlying). Same shape as Position.
| Function | Returns |
|---|---|
ORT_UNDERLYING_VALUE(account, conidOrUnderlying, fieldName) | Underlying value (number = contract ID, string = underlying). |
ORT_UNDERLYING_CONIDS_SIZE(account) | Number of underlying rows for the account. |
ORT_UNDERLYING_CONID_AT(account, index) | Contract ID at a 1-based index, ascending. |
ORT_UNDERLYING_SYMBOLS_SIZE(account) | Number of distinct underlyings. |
ORT_UNDERLYING_SYMBOL_AT(account, index) | Underlying at a 1-based index, alphabetical. |
ORT_UNDERLYING_FIELDS_SIZE() | Number of underlying fields. |
ORT_UNDERLYING_FIELD_AT(index) | Underlying field name at a 1-based index. |
Examples
Section titled “Examples”Read a single value.
=ORT_SYSTEM_VALUE("U1234567", "BYTES_SYSTEM")=ORT_PORTFOLIO_VALUE("My IRA", "NET_LIQUIDATION")=ORT_POSITION_VALUE("U1234567", "AAPL", "PNL")=ORT_POSITION_VALUE("U1234567", 265598, "DELTA_DOLLARS")=ORT_UNDERLYING_VALUE("U1234567", "SPY", "THETA")List the accounts. Read one at a time, or return the whole list with SEQUENCE.
=ORT_ACCOUNT_AT(1)=ORT_ACCOUNTS_SIZE()=ORT_ACCOUNT_AT(SEQUENCE(ORT_ACCOUNTS_SIZE()))=ORT_ACCOUNT_NAME_AT(SEQUENCE(ORT_ACCOUNTS_SIZE()))ORT_ACCOUNT_AT(1) returns one account ID, such as "U1234567", and ORT_ACCOUNTS_SIZE() returns the count. SEQUENCE turns the count into 1..n, so the last two return every account ID and every account name down a column. SEQUENCE(1, n) returns a row instead of a column.
Discover the field names. Every value function takes a fieldName. The valid names for a table are listed with the same size-then-at pattern: get the count, read one name, or return them all.
=ORT_SYSTEM_FIELDS_SIZE()=ORT_SYSTEM_FIELD_AT(1)=ORT_SYSTEM_FIELD_AT(SEQUENCE(ORT_SYSTEM_FIELDS_SIZE()))ORT_SYSTEM_FIELDS_SIZE() is the count, ORT_SYSTEM_FIELD_AT(1) is the first name, and the spilled form returns all of them. Each name returned is a valid fieldName for ORT_SYSTEM_VALUE. The other tables follow the same pattern:
=ORT_PORTFOLIO_FIELD_AT(SEQUENCE(ORT_PORTFOLIO_FIELDS_SIZE()))=ORT_POSITION_FIELD_AT(SEQUENCE(ORT_POSITION_FIELDS_SIZE()))=ORT_UNDERLYING_FIELD_AT(SEQUENCE(ORT_UNDERLYING_FIELDS_SIZE()))Contracts and symbols use the same pattern, but are per-account, so the account argument appears in both the *_SIZE and the *_AT. To list every underlying symbol held in one account:
=ORT_UNDERLYING_SYMBOL_AT("U1234567", SEQUENCE(ORT_UNDERLYING_SYMBOLS_SIZE("U1234567")))ORT_UNDERLYING_SYMBOLS_SIZE("U1234567") is the count for that account, SEQUENCE makes it a column, and ORT_UNDERLYING_SYMBOL_AT reads each index, so the account’s symbols are returned down a column. The Position table has the same pair (ORT_POSITION_SYMBOL_AT with ORT_POSITION_SYMBOLS_SIZE), and contracts use the *_CONID_AT / *_CONIDS_SIZE pair.
Symbols and contracts are per-account and take the account argument; field names are the same schema for every account, so ORT_*_FIELDS_SIZE() and ORT_*_FIELD_AT() take none.
Build a dropdown. Set an in-cell dropdown (Data tab, Data validation, list type) to a spilled range such as the account names above. When the dropdown cell changes, formulas that reference it recompute against the new selection.
Saving
Section titled “Saving”Saving the Spreadsheet View stores the workbook: all of its sheets, with their cells, formulas, and formatting. Definitions are written only on an explicit Save, so an unsaved edit does not overwrite the saved layout.
Saved views are shared by every browser on the network, so loading a view on another machine opens the same workbook.
Charting a value
Section titled “Charting a value”The Spreadsheet displays values. To record one as a time series and put it in a quote or a chart, create a stream for the same field. Streams feed the Quotes Bar and the Dashboard.