Reports
Reports show positions in a table grouped by a chosen dimension. Two grouping modes are available:
- Underlying: groups positions by underlying symbol
- Expiry: groups positions by expiration date
Each grouping mode supports a Details view (every individual position) and a Summary view (aggregated by the grouping dimension). Values aggregate across the accounts selected in the account selector.
Underlying Details:
Toolbar
Section titled “Toolbar”- View selector: switch between named configurations
- Save: save the current configuration; the button label reflects the active grouping and view (for example Save Underlying Details View or Save Expiry Summary View)
- View Actions (hamburger menu): Reload, Save As, Rename, and Delete the current view (Rename and Delete are unavailable for the Default view)
- Group: toggle between Underlying and Expiry grouping
- View: toggle between Details and Summary
- Columns: open the column picker to choose which columns to display
- Auto Size: auto-fit all column widths to cell contents
- Font size: controls the size of report text
- Filter: toggle the Position Filter panel on the right side of the component
Underlying and Expiry Reports
Section titled “Underlying and Expiry Reports”The Group toggle switches between grouping by underlying symbol and grouping by expiry date. The View toggle switches between Details (every position) and Summary (aggregated by the grouping dimension).
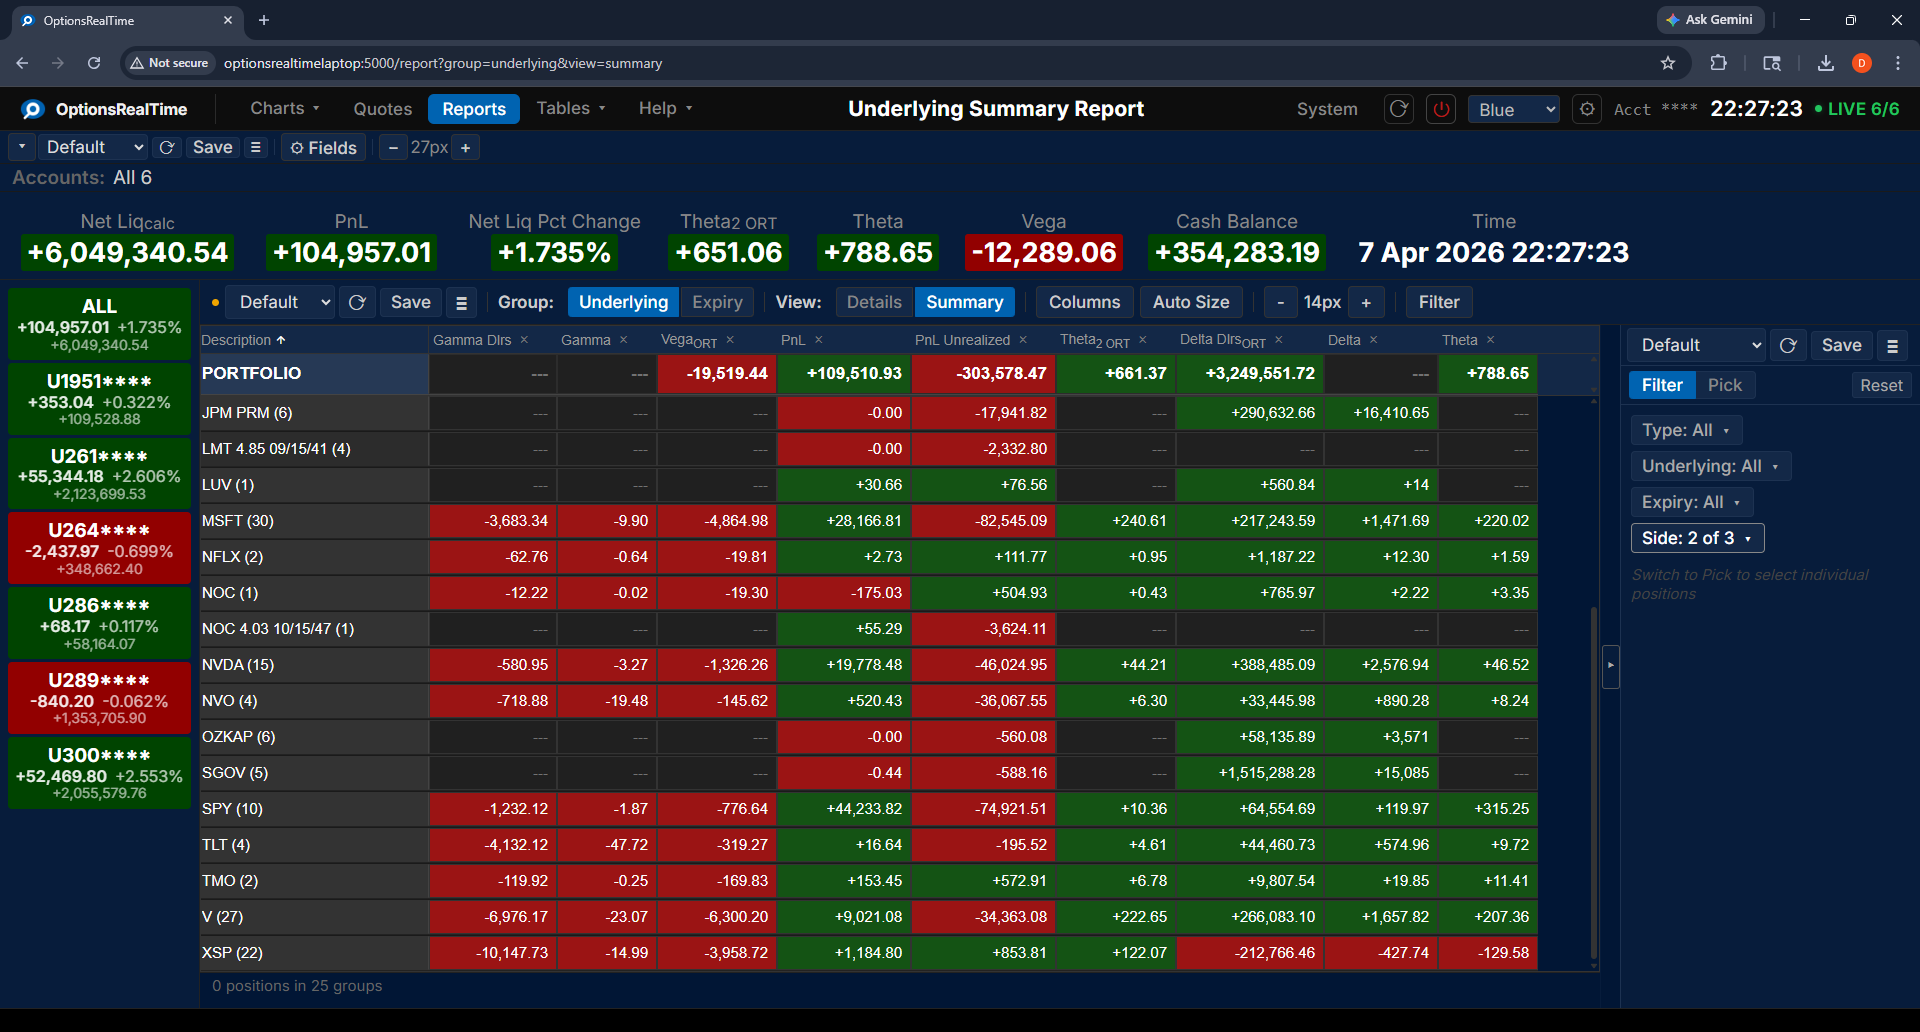
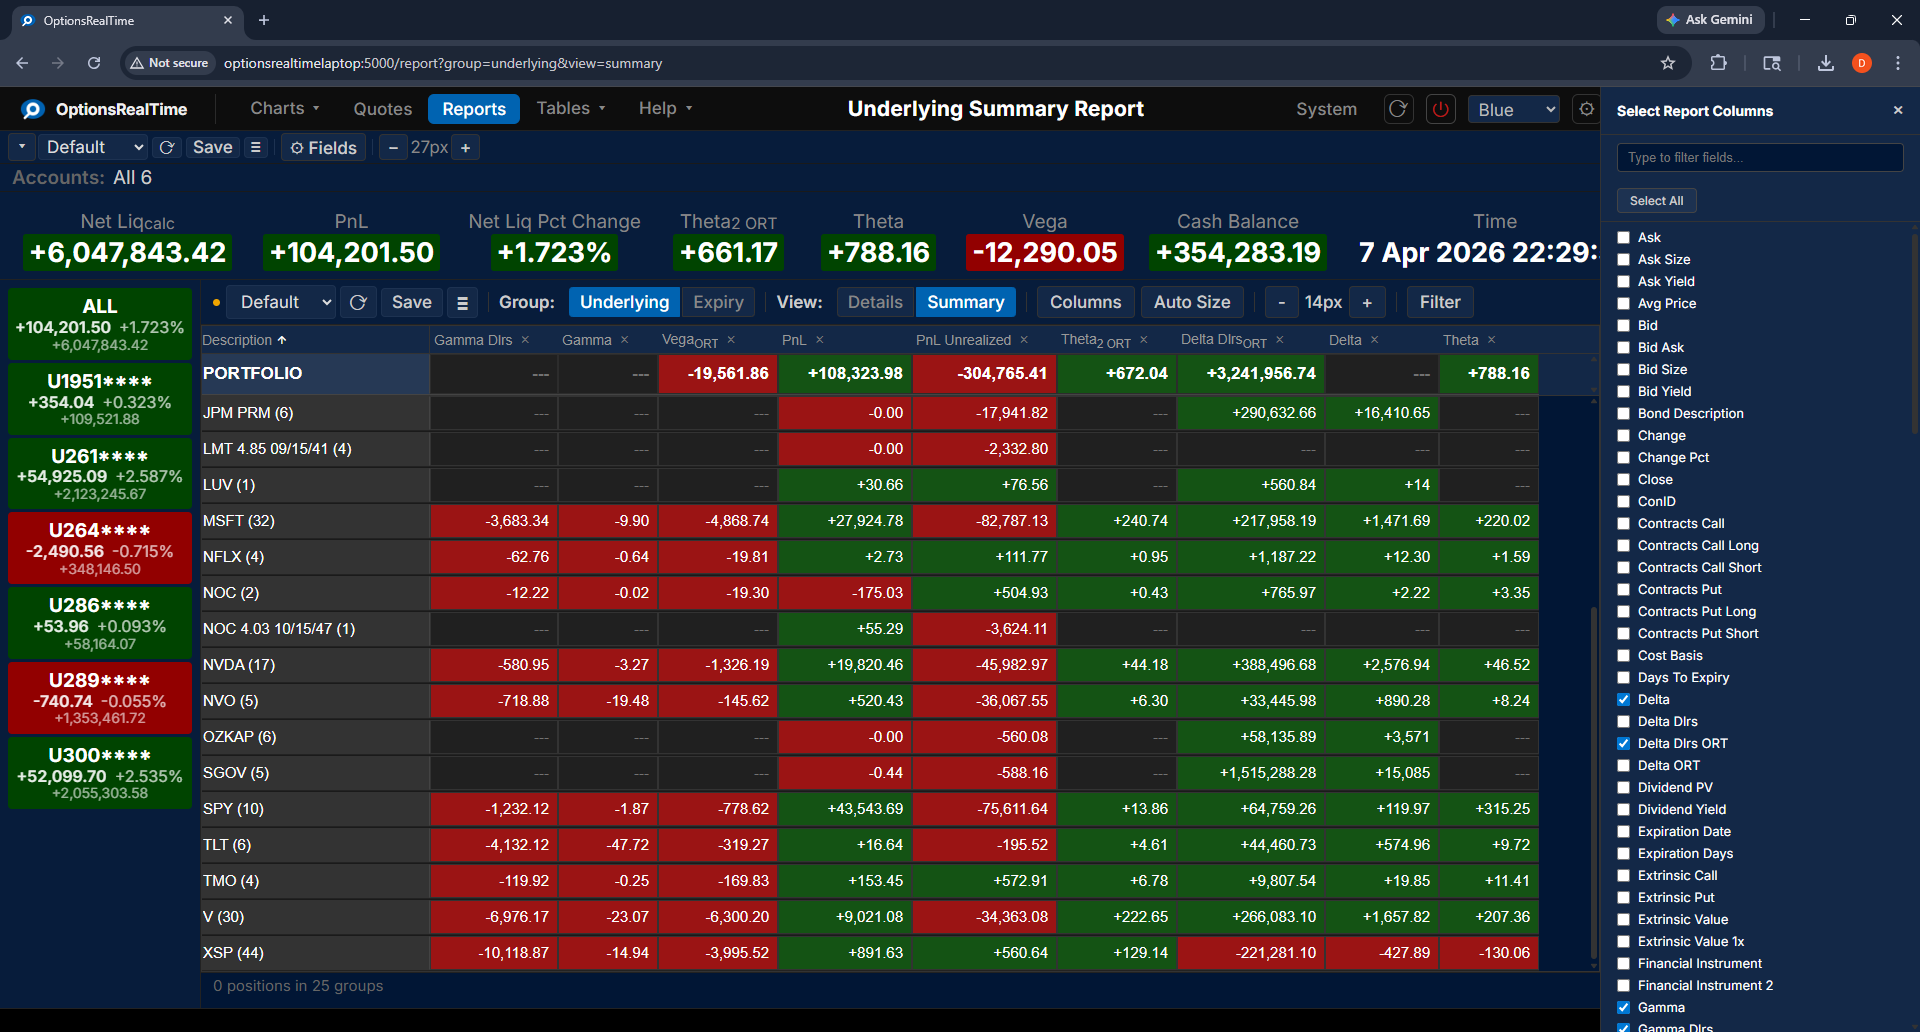
Underlying Summary:
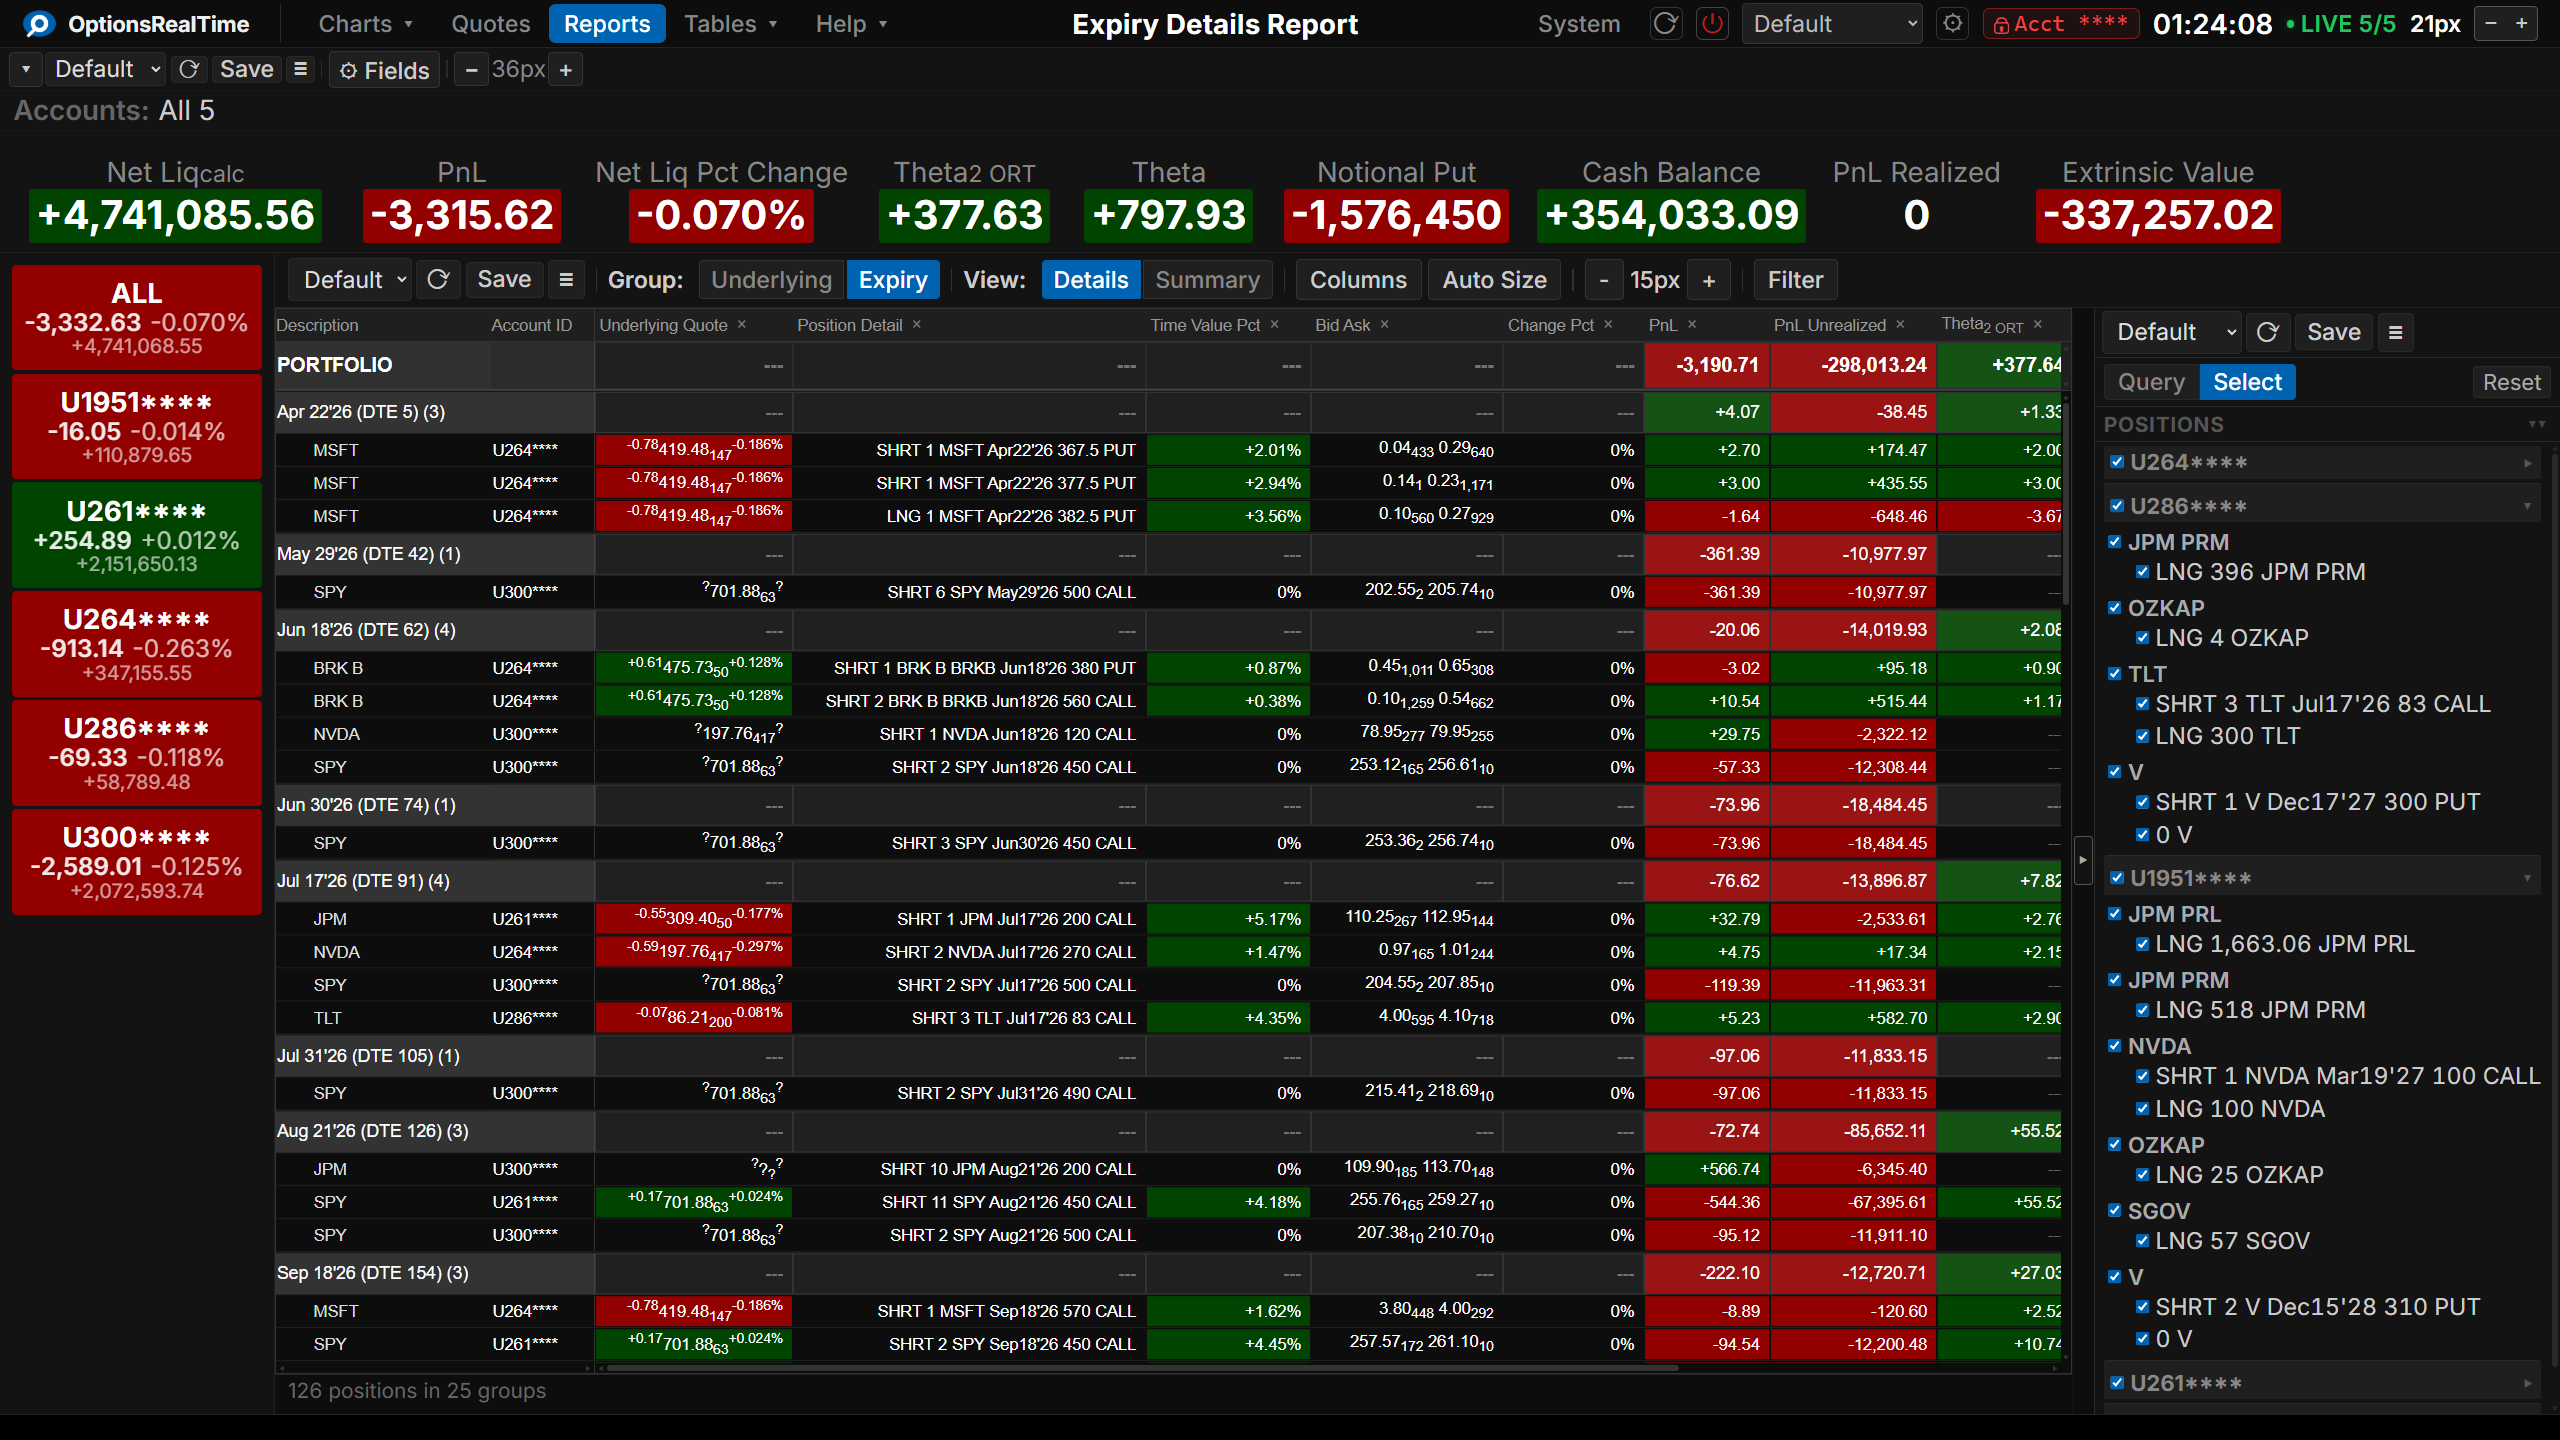
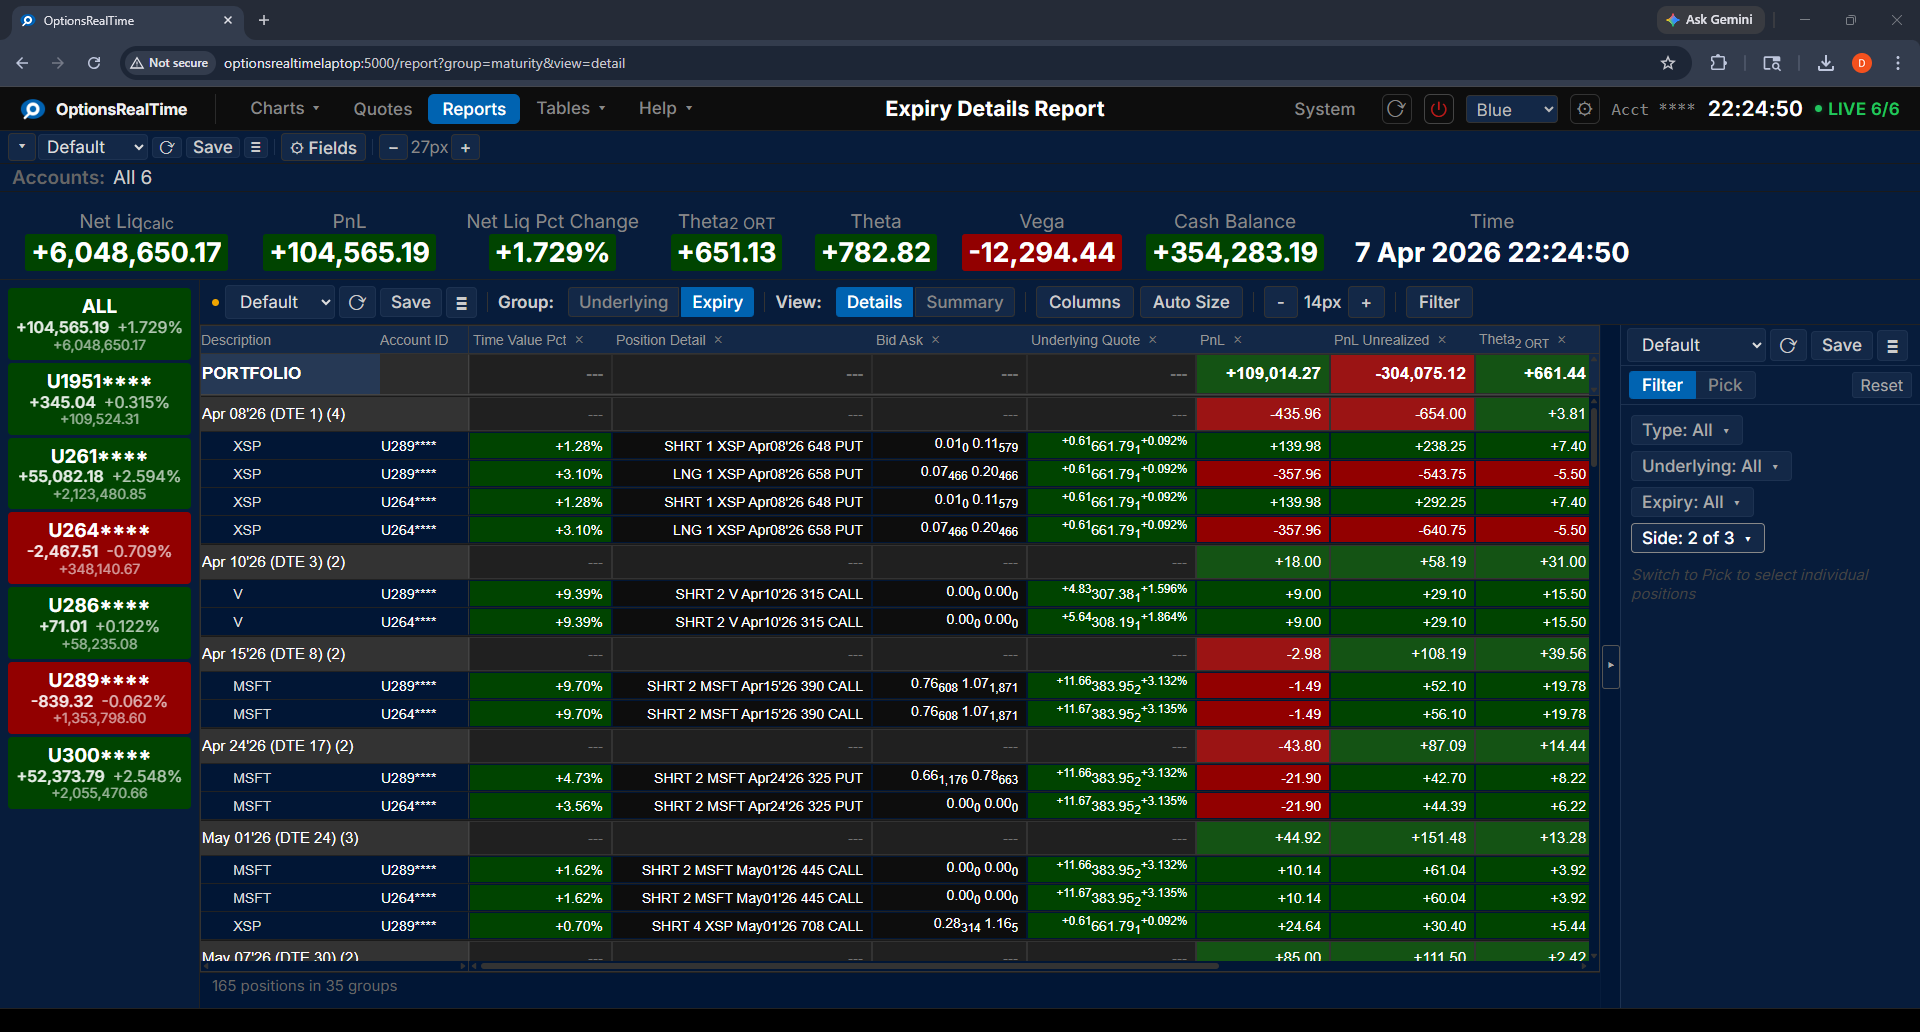
Expiry Details:
Expiry Summary:

Columns
Section titled “Columns”Clicking Columns in the toolbar opens a side panel listing every available report column with a checkbox. Checked columns are shown in the report. Column selection is saved with the report view.
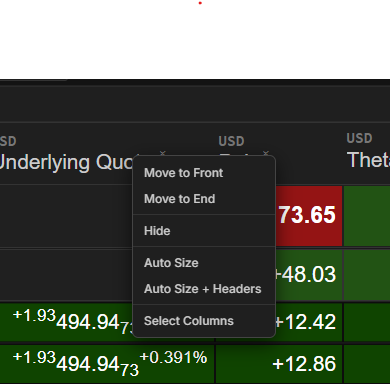
Column Menu
Section titled “Column Menu”Right-clicking a column header opens a menu of column actions:
- Move to Front: move the column to the beginning of the report
- Move to End: move the column to the end of the report
- Hide: remove the column from the report
- Auto Size: size the column to fit its contents
- Select Columns: open the Columns side panel
Position Filter
Section titled “Position Filter”This component supports the Position Filter, a right-side panel that narrows the report to a chosen subset of positions. A filter selector narrows the selection by any combination of underlyings, type, side, or expiry, which can then be refined in the panel.
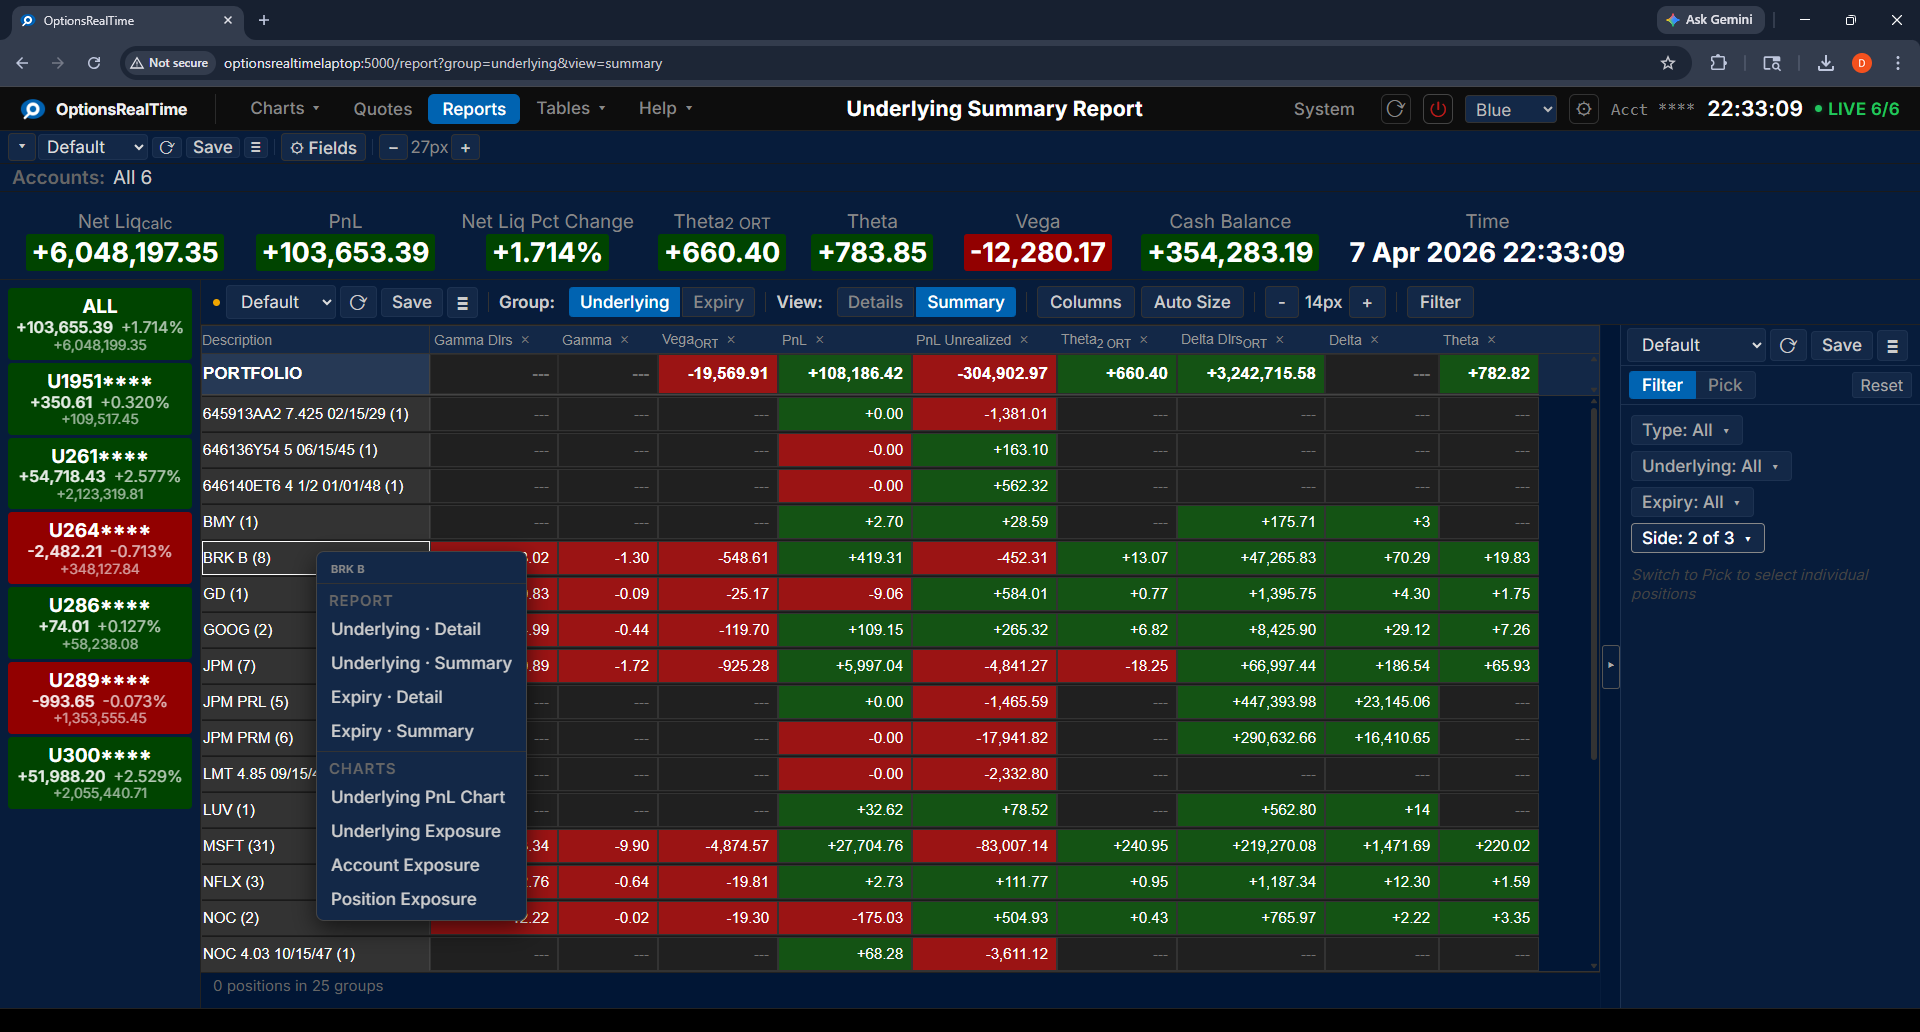
Right-Click Navigation
Section titled “Right-Click Navigation”Right-clicking any row in the report opens a context menu with links to related reports and charts, filtered to the selected underlying and accounts.