Portfolio PnL Chart
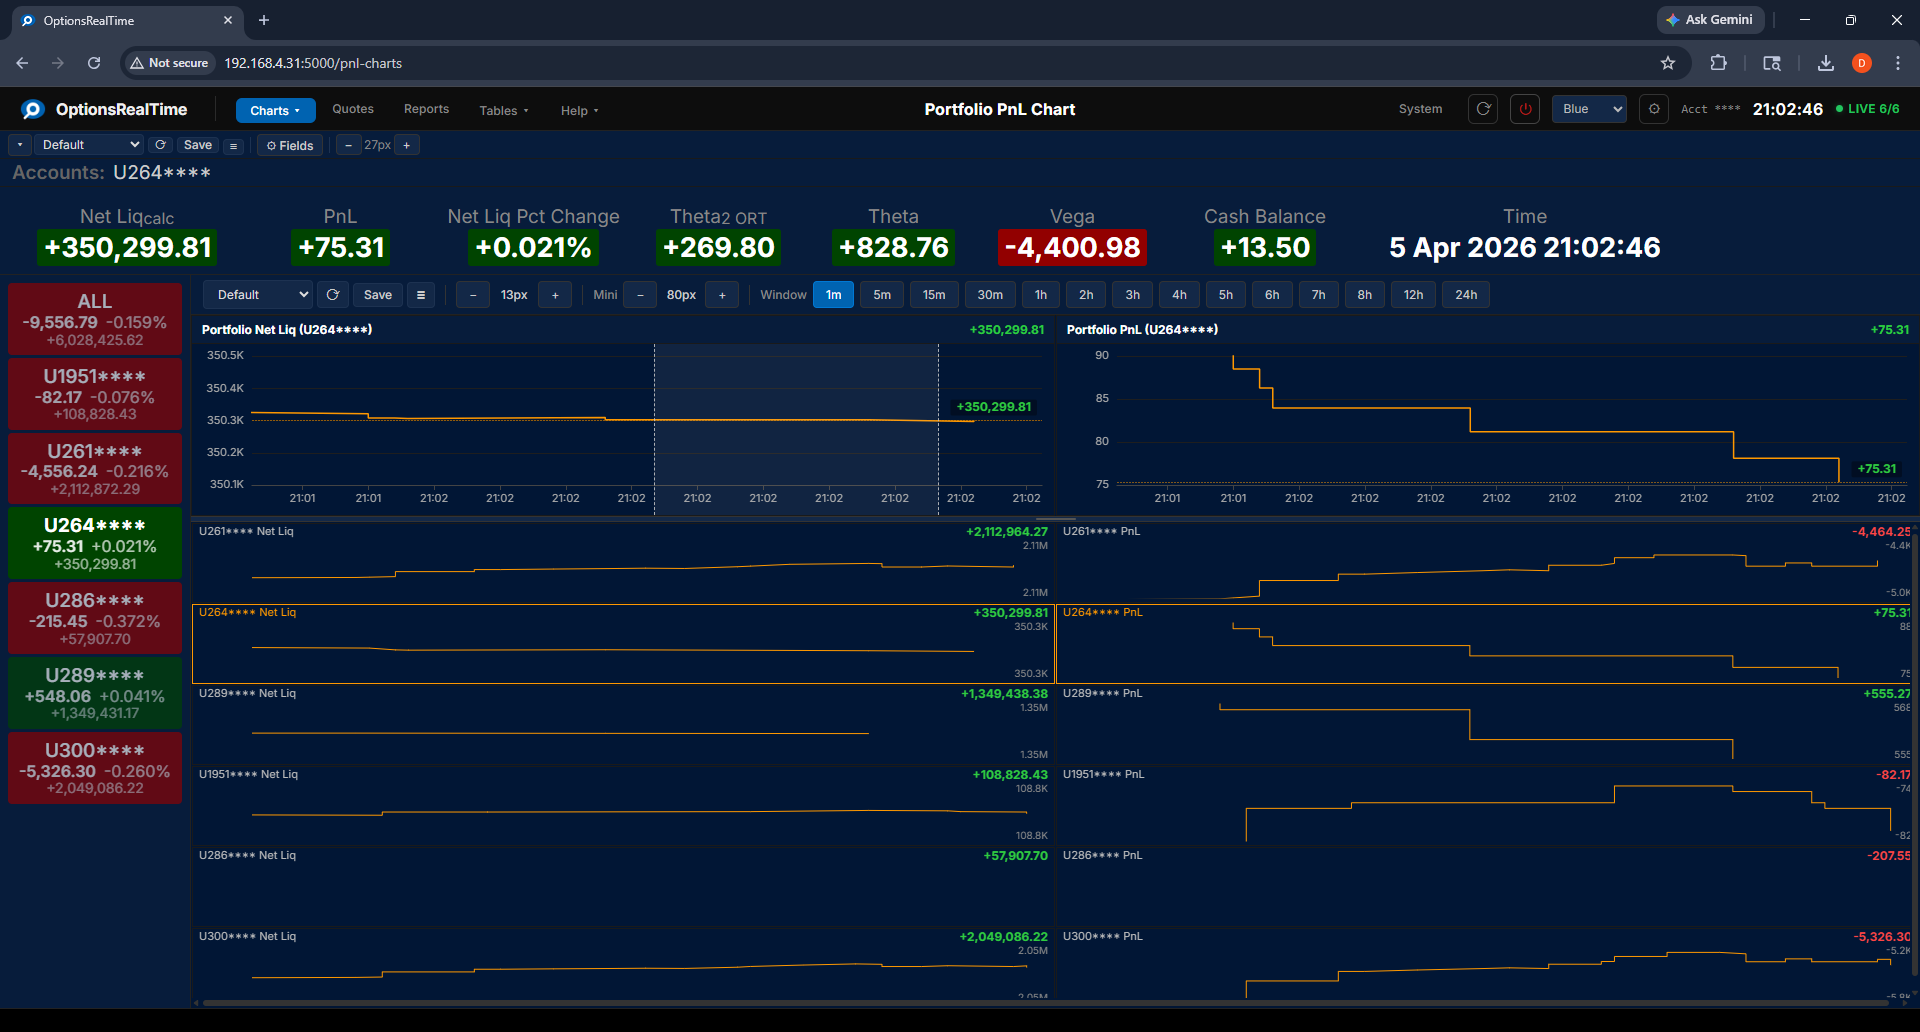
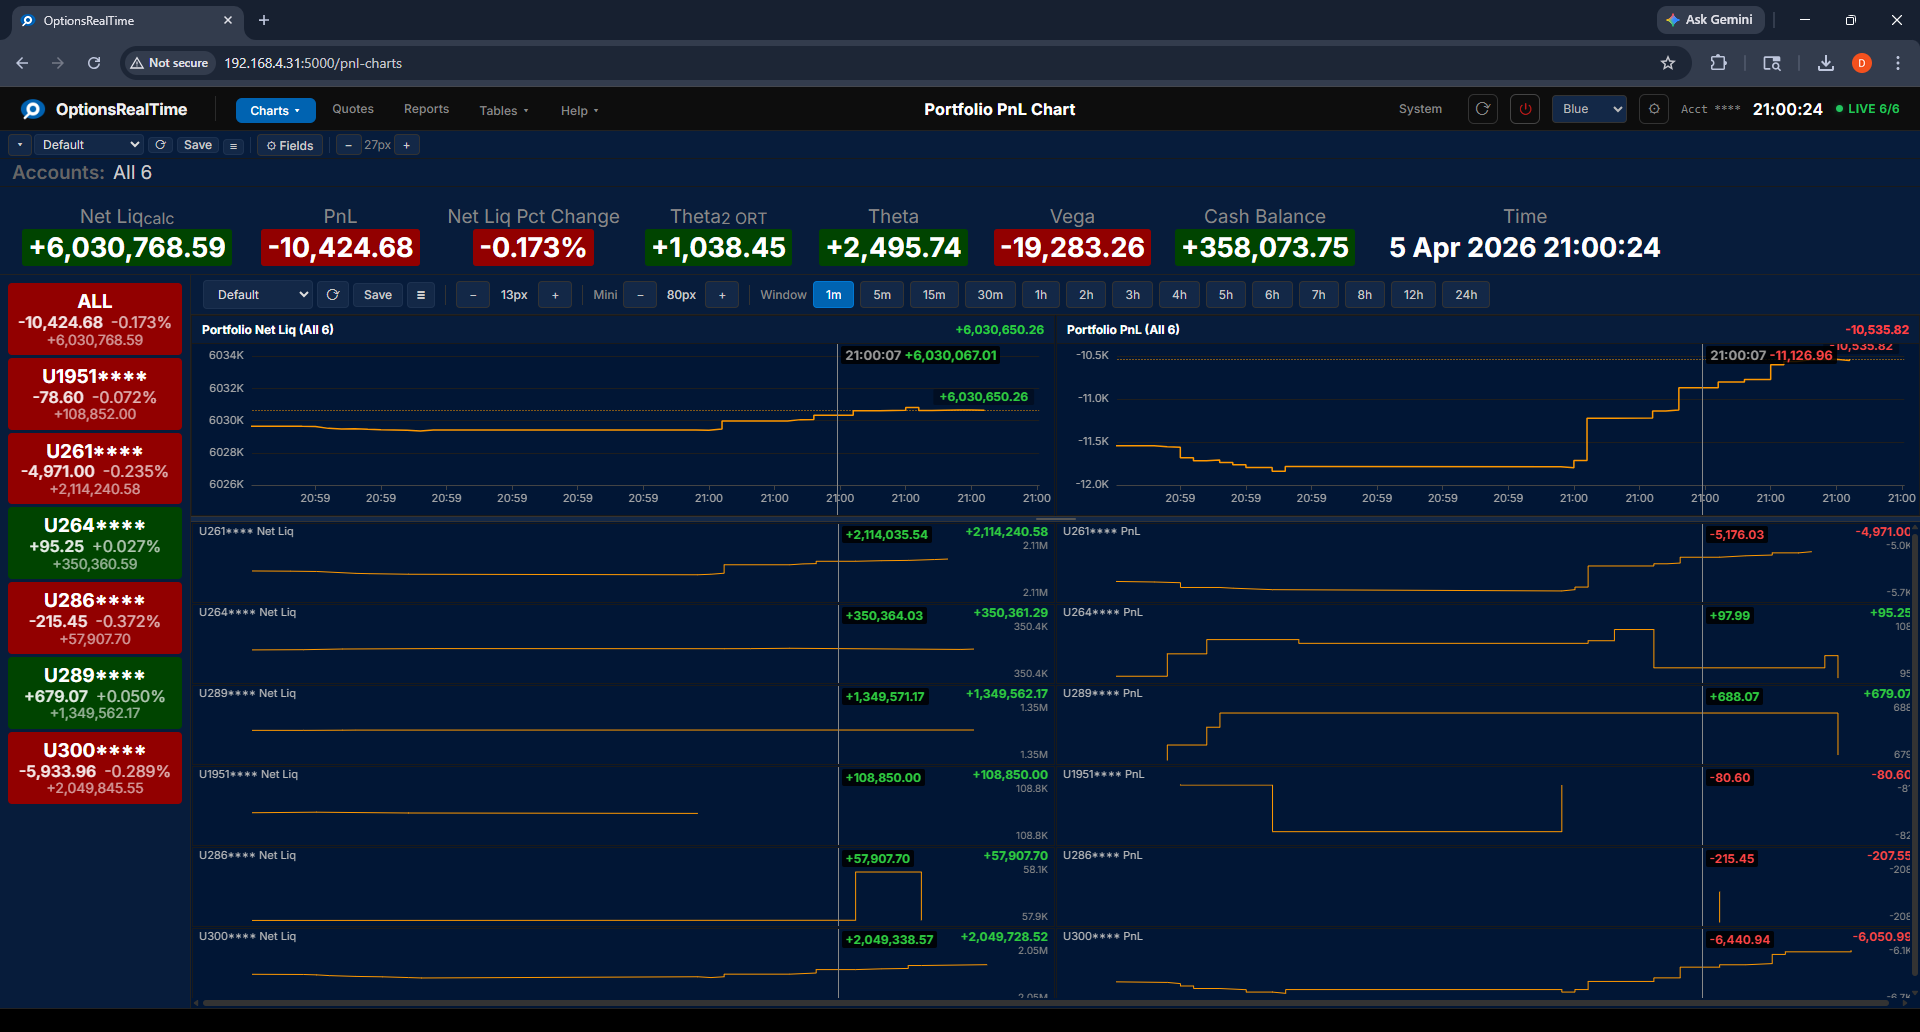
The Portfolio PnL Chart displays two live charts side by side. The left chart shows portfolio net liquidation value and the right chart shows profit and loss, both plotted over time.
The top line in each chart shows the total across all accounts. Below are individual lines for each account, color-coded and labeled with the account name and current value.
Toolbar
Section titled “Toolbar”- View selector: switch between named configurations
- Save Portfolio PnL View: save the current configuration
- View Actions (hamburger menu): Reload, Save As, Rename, and Delete the current view (Rename and Delete are unavailable for the Default view)
- Mini pixels: set the height in pixels for each account sub-chart
- Time window: select the time range to display (1m, 5m, 15m, 30m, 1h, 2h, 3h, 4h, 5h, 6h, 7h, 8h, 12h, 24h)
Single account selected:
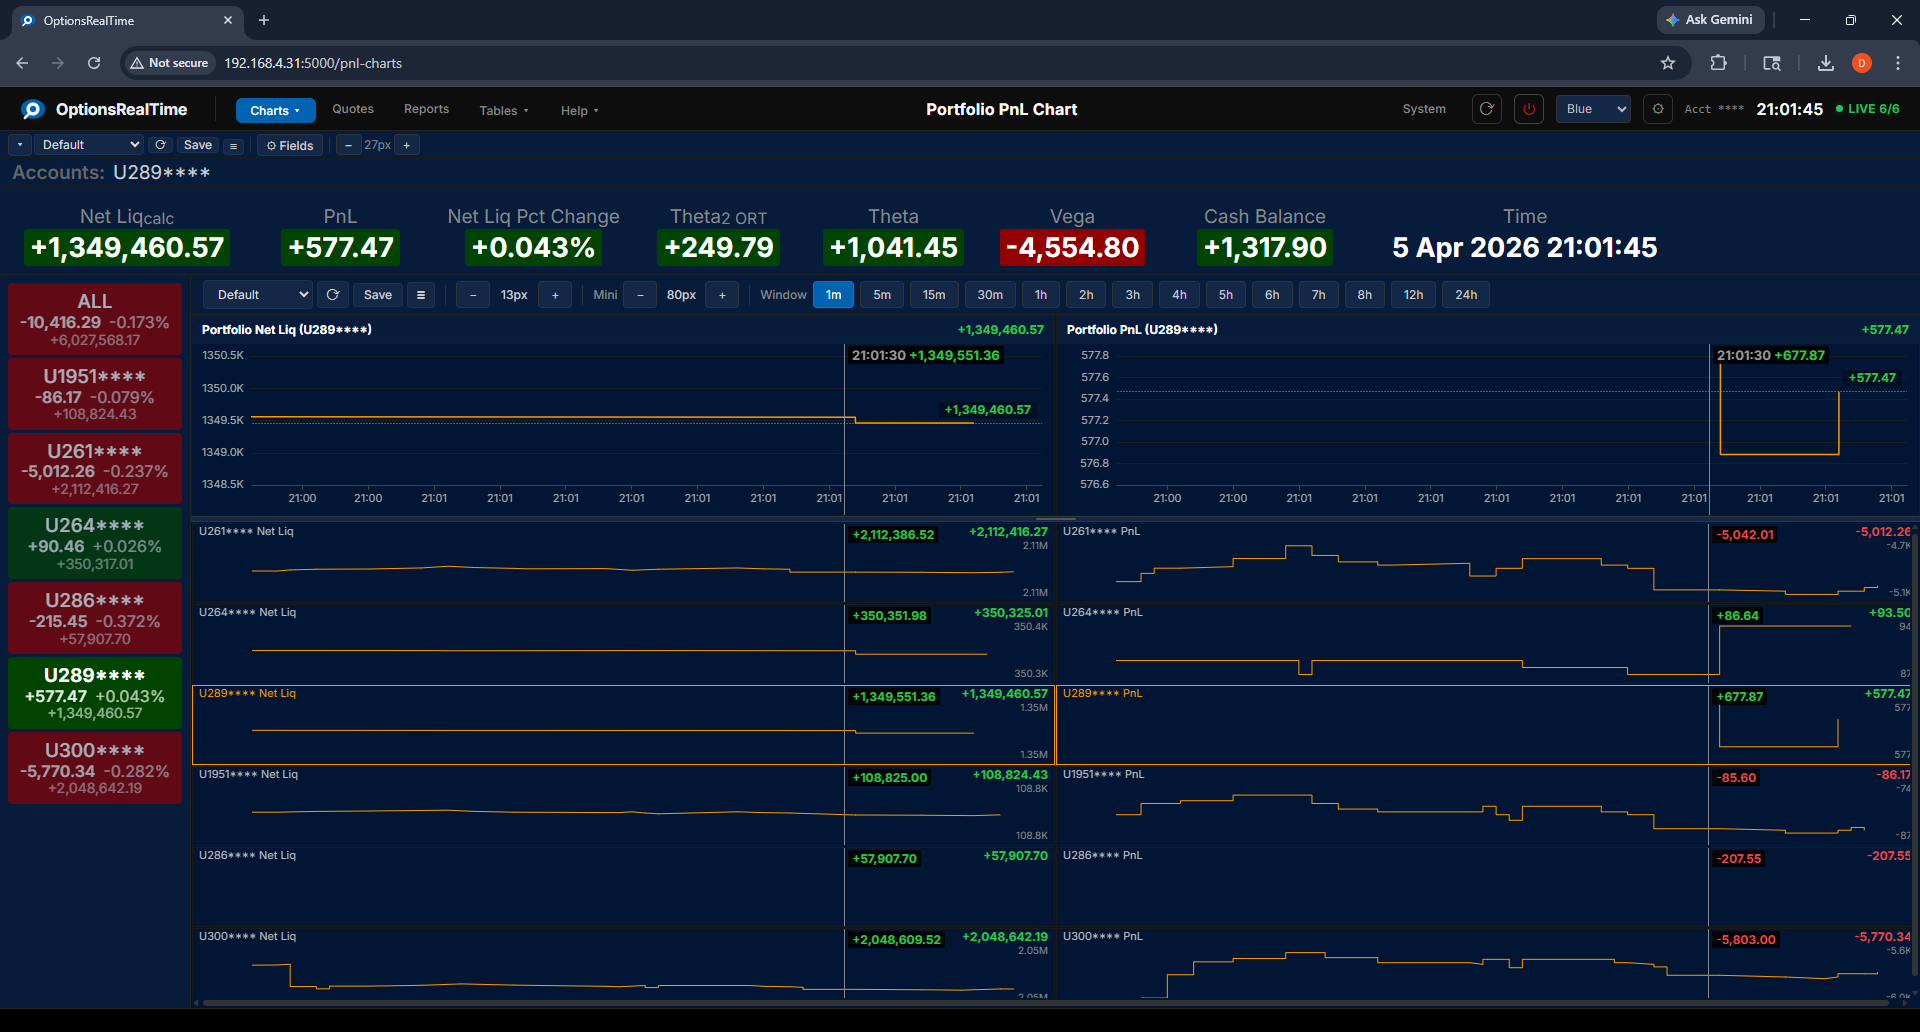
Chart Interaction
Section titled “Chart Interaction”- Mousewheel: zoom in and out
- Left-click drag: draw a zoom rectangle, release to zoom to that area
- Double-click: revert to default view (on either main chart)
- Reset button (upper right of chart): revert to default view
Both charts support zooming and panning, with the time axis synced between them.