Expiry Exposure Chart
The Expiry Exposure chart shows a selected metric for an underlying, aggregated by expiration date. Each bar represents an expiration, stacked with a segment for each position at that expiration. A “No Exp” bar collects positions that do not expire, such as the underlying stock, bond, future or ETF. Positions are colorized by the value chosen in the Color selector, either the annualized yield of extrinsic value or delta. Under Yield, underlying positions carry no yield and appear in gray. A thin colored bar to the left of each position segment indicates the account that holds it.
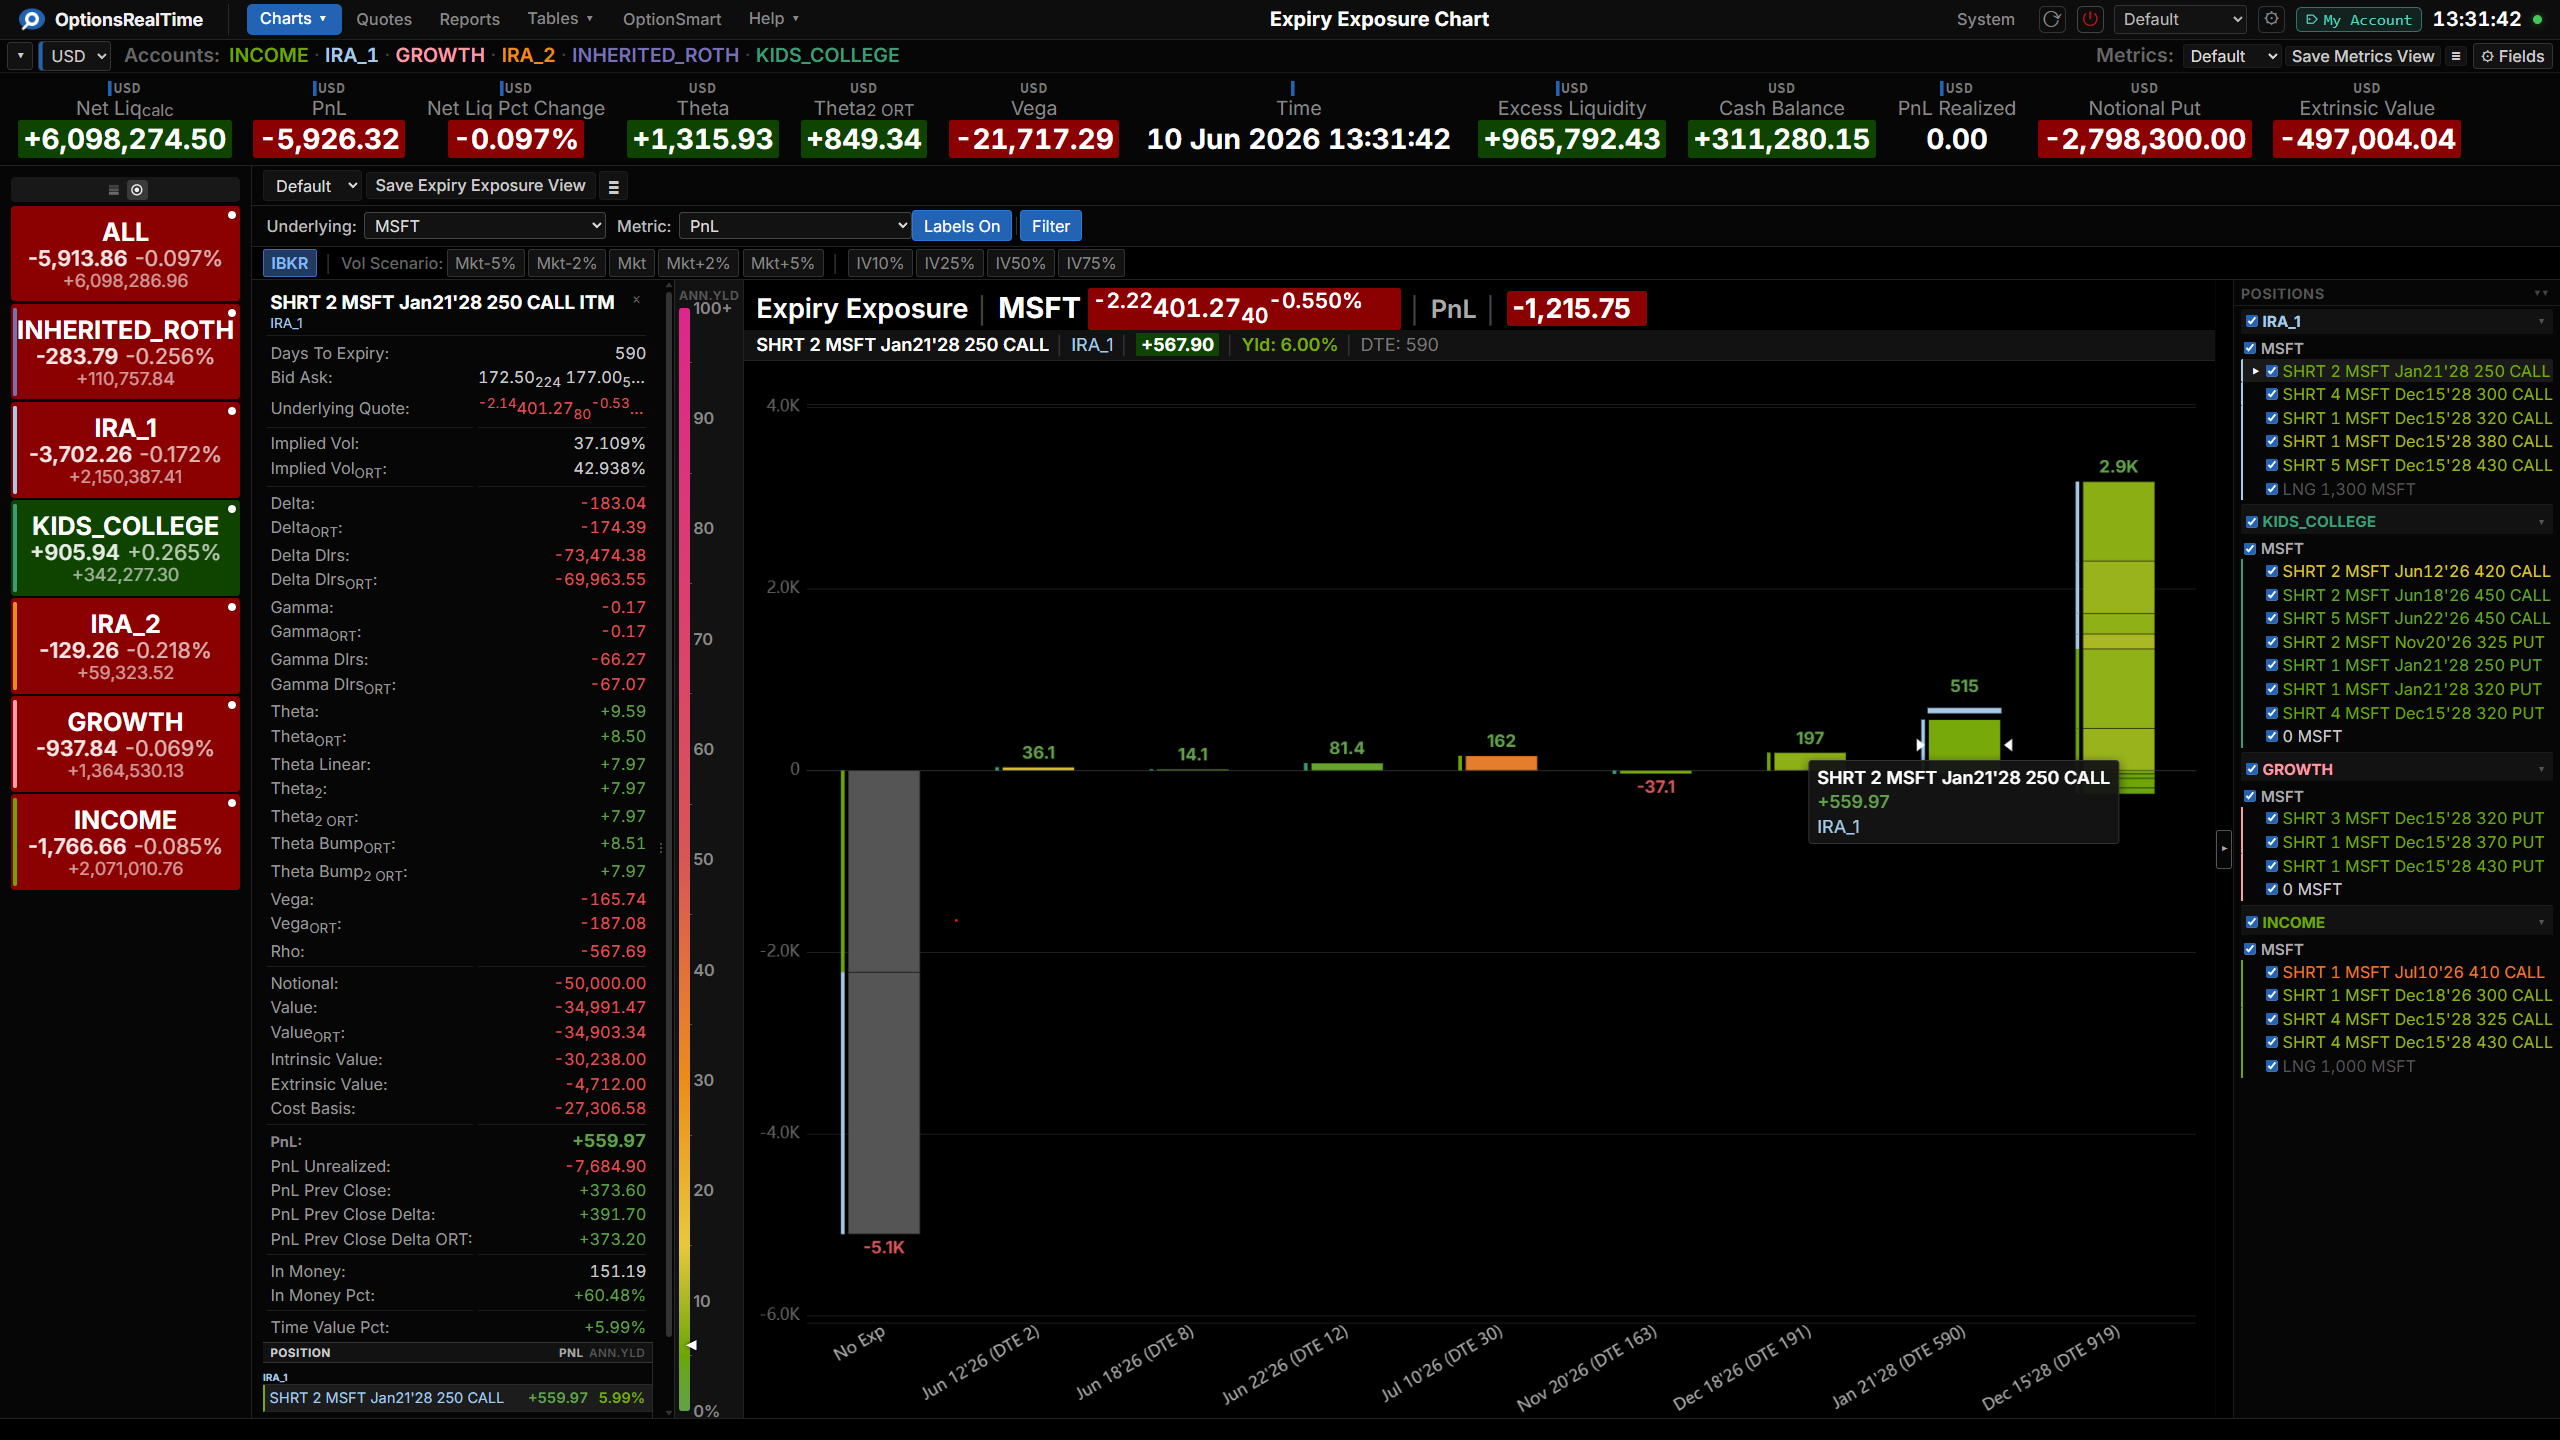
The chart header displays the selected underlying, its price and percent change, the selected metric, and the total of the metric across all expirations. The horizontal axis lists each expiration date with its days to expiry (DTE). The vertical axis shows the selected metric. A color bar on the left edge maps the scale used to color the position segments, following the Color selection.
Toolbar
Section titled “Toolbar”- View selector: switch between named configurations
- Save Expiry Exposure View: save the current configuration
- View Actions (hamburger menu): Reload, Save As, Rename, and Delete the current view (Rename and Delete are unavailable for the Default view)
- Underlying selector: choose which underlying to display
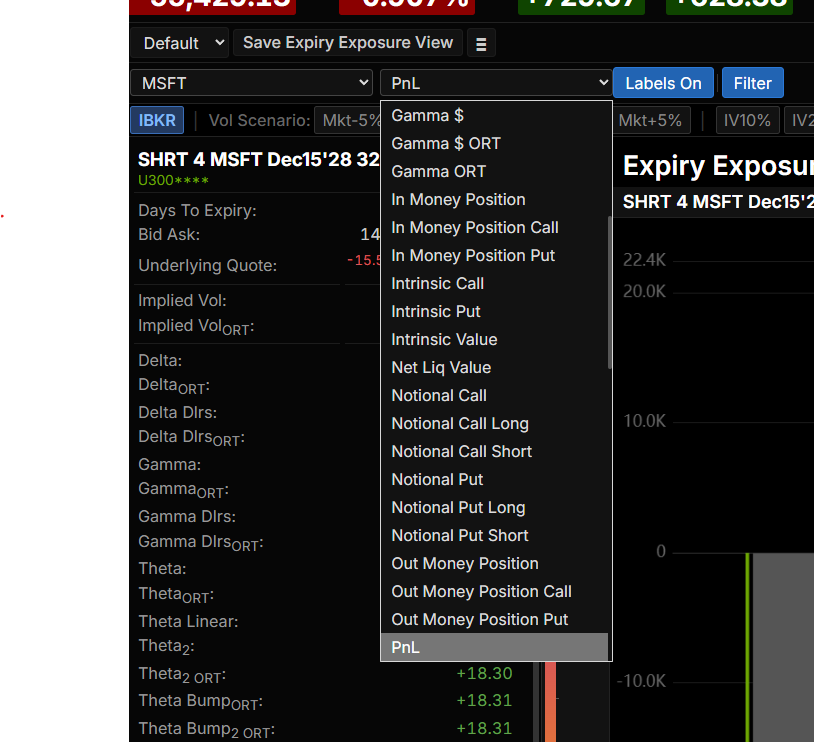
- Metric: select the metric shown on the chart
- Color: color the position segments by Yield (the annualized yield of extrinsic value) or by Delta
- Labels On: toggle value labels on each bar
- Filter: toggle the Position Filter panel on the right side of the component
Position Filter
Section titled “Position Filter”This chart covers one underlying at a time. Positions can be selected in the Position Filter panel on the right, toggled with the Filter button in the toolbar.
Metrics
Section titled “Metrics”Select any metric from the dropdown to update the chart. Available metrics include PnL, the Greeks (Delta, Gamma, Theta, Vega) with IBKR and ORT variants, Intrinsic and Extrinsic Value, Notional with Call/Put and Long/Short breakdowns, In and Out of the Money position counts, and Net Liquidation Value.
Side Panel
Section titled “Side Panel”The side panel can be opened by clicking the expand/contract tab in the center-left edge of the chart. The top of the panel displays details for the selected position, including days to expiry, bid and ask, implied volatility, the Greeks with their ORT variants, value, intrinsic and extrinsic value, cost basis, PnL, and annualized yield.
Left-clicking any position in a bar selects that position, which is displayed at the top of the side panel. The lower part of the panel lists every position for that expiration, with the selected position highlighted. Clicking a position in that list selects it in the bar and updates the details at the top of the panel.
Vol Scenario
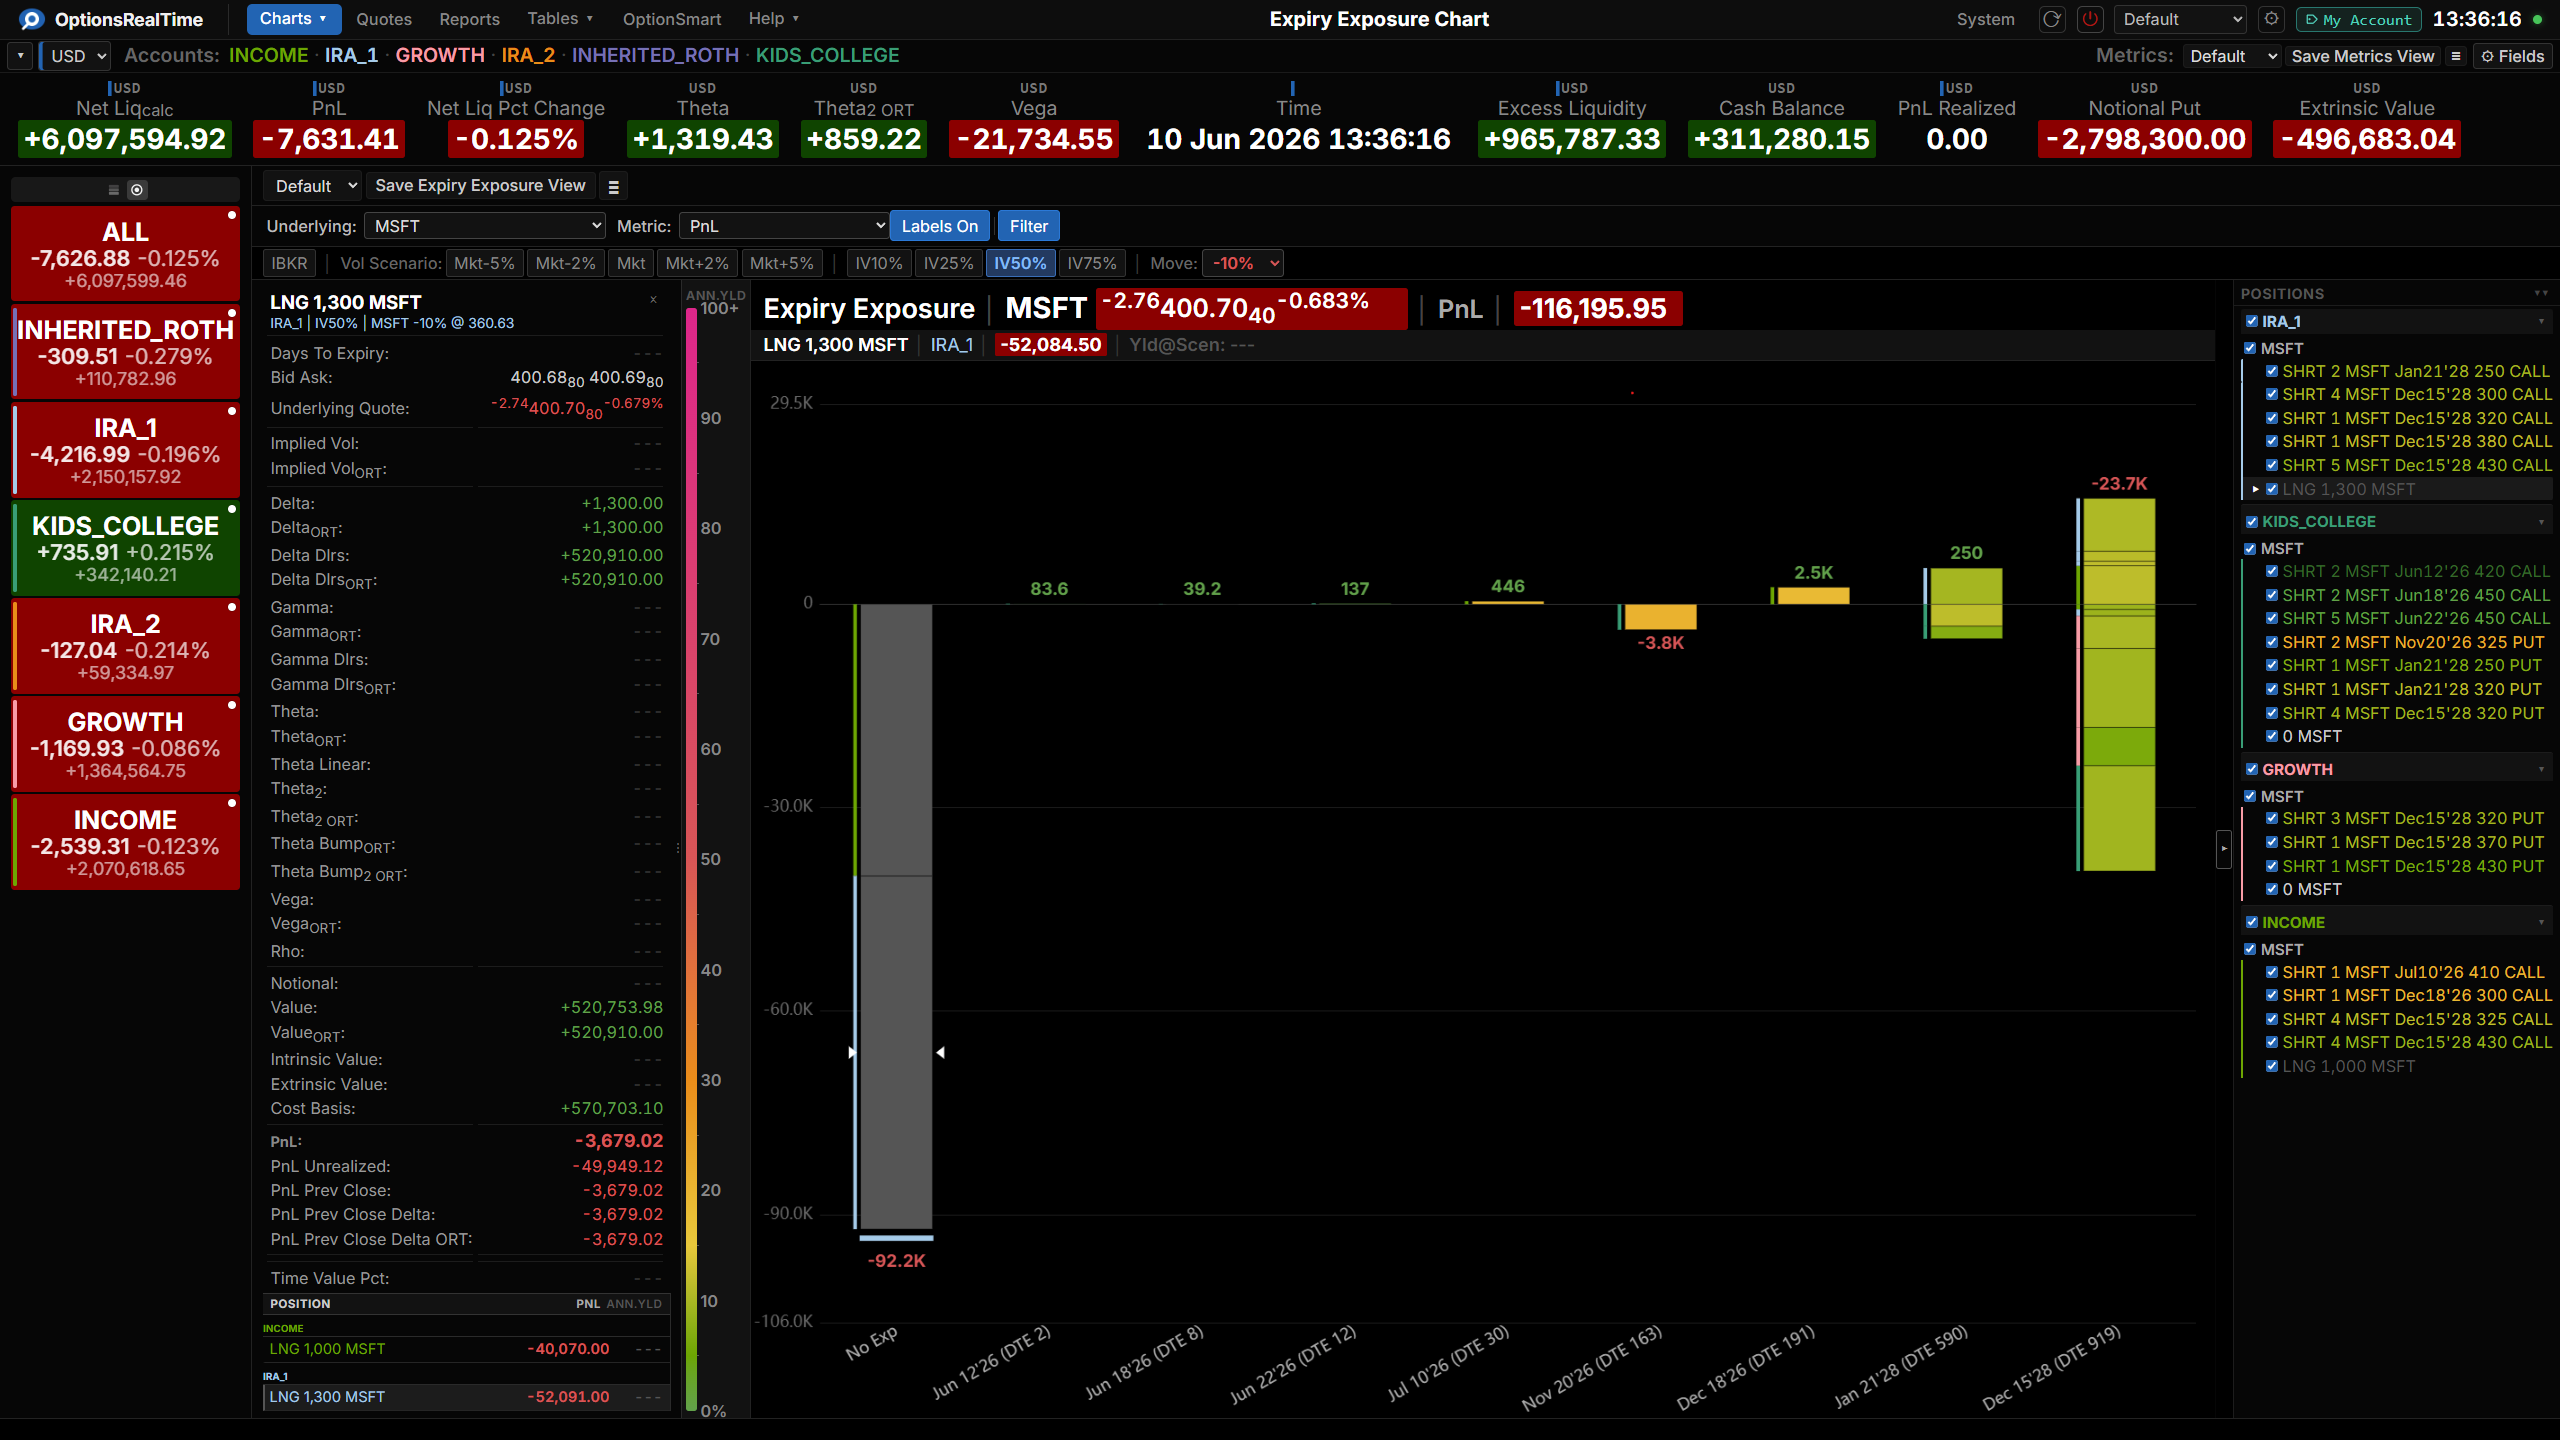
Section titled “Vol Scenario”The Vol Scenario toolbar switches between live IBKR market data and analytical what-if modeling:
- IBKR: live market values from IBKR
- Mkt: model using current market implied volatility
- Mkt-5%, Mkt-2%, Mkt+2%, Mkt+5%: model after adding or subtracting 2 or 5 percentage points to the implied volatility solved for, across all options
- IV10%, IV25%, IV50%, IV75%: model using scenario implied volatility levels
A Move selector follows the IV buttons, applying a price change to the underlying from -20% to +20%. The chart updates to show the projected metric under both the IV scenario and the price move.
Right-Click Navigation
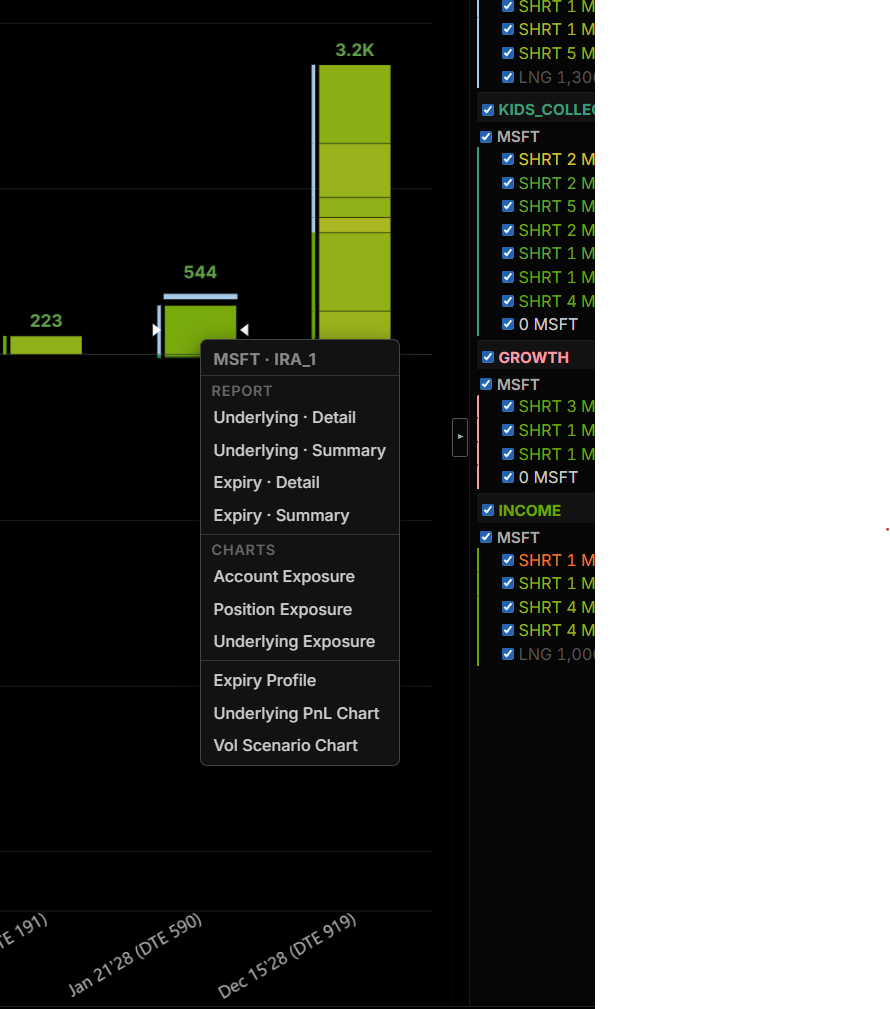
Section titled “Right-Click Navigation”Right-clicking a bar segment or a position in the side panel opens a context menu with links to related reports and charts, filtered to the selected underlying and accounts.