
Dashboard
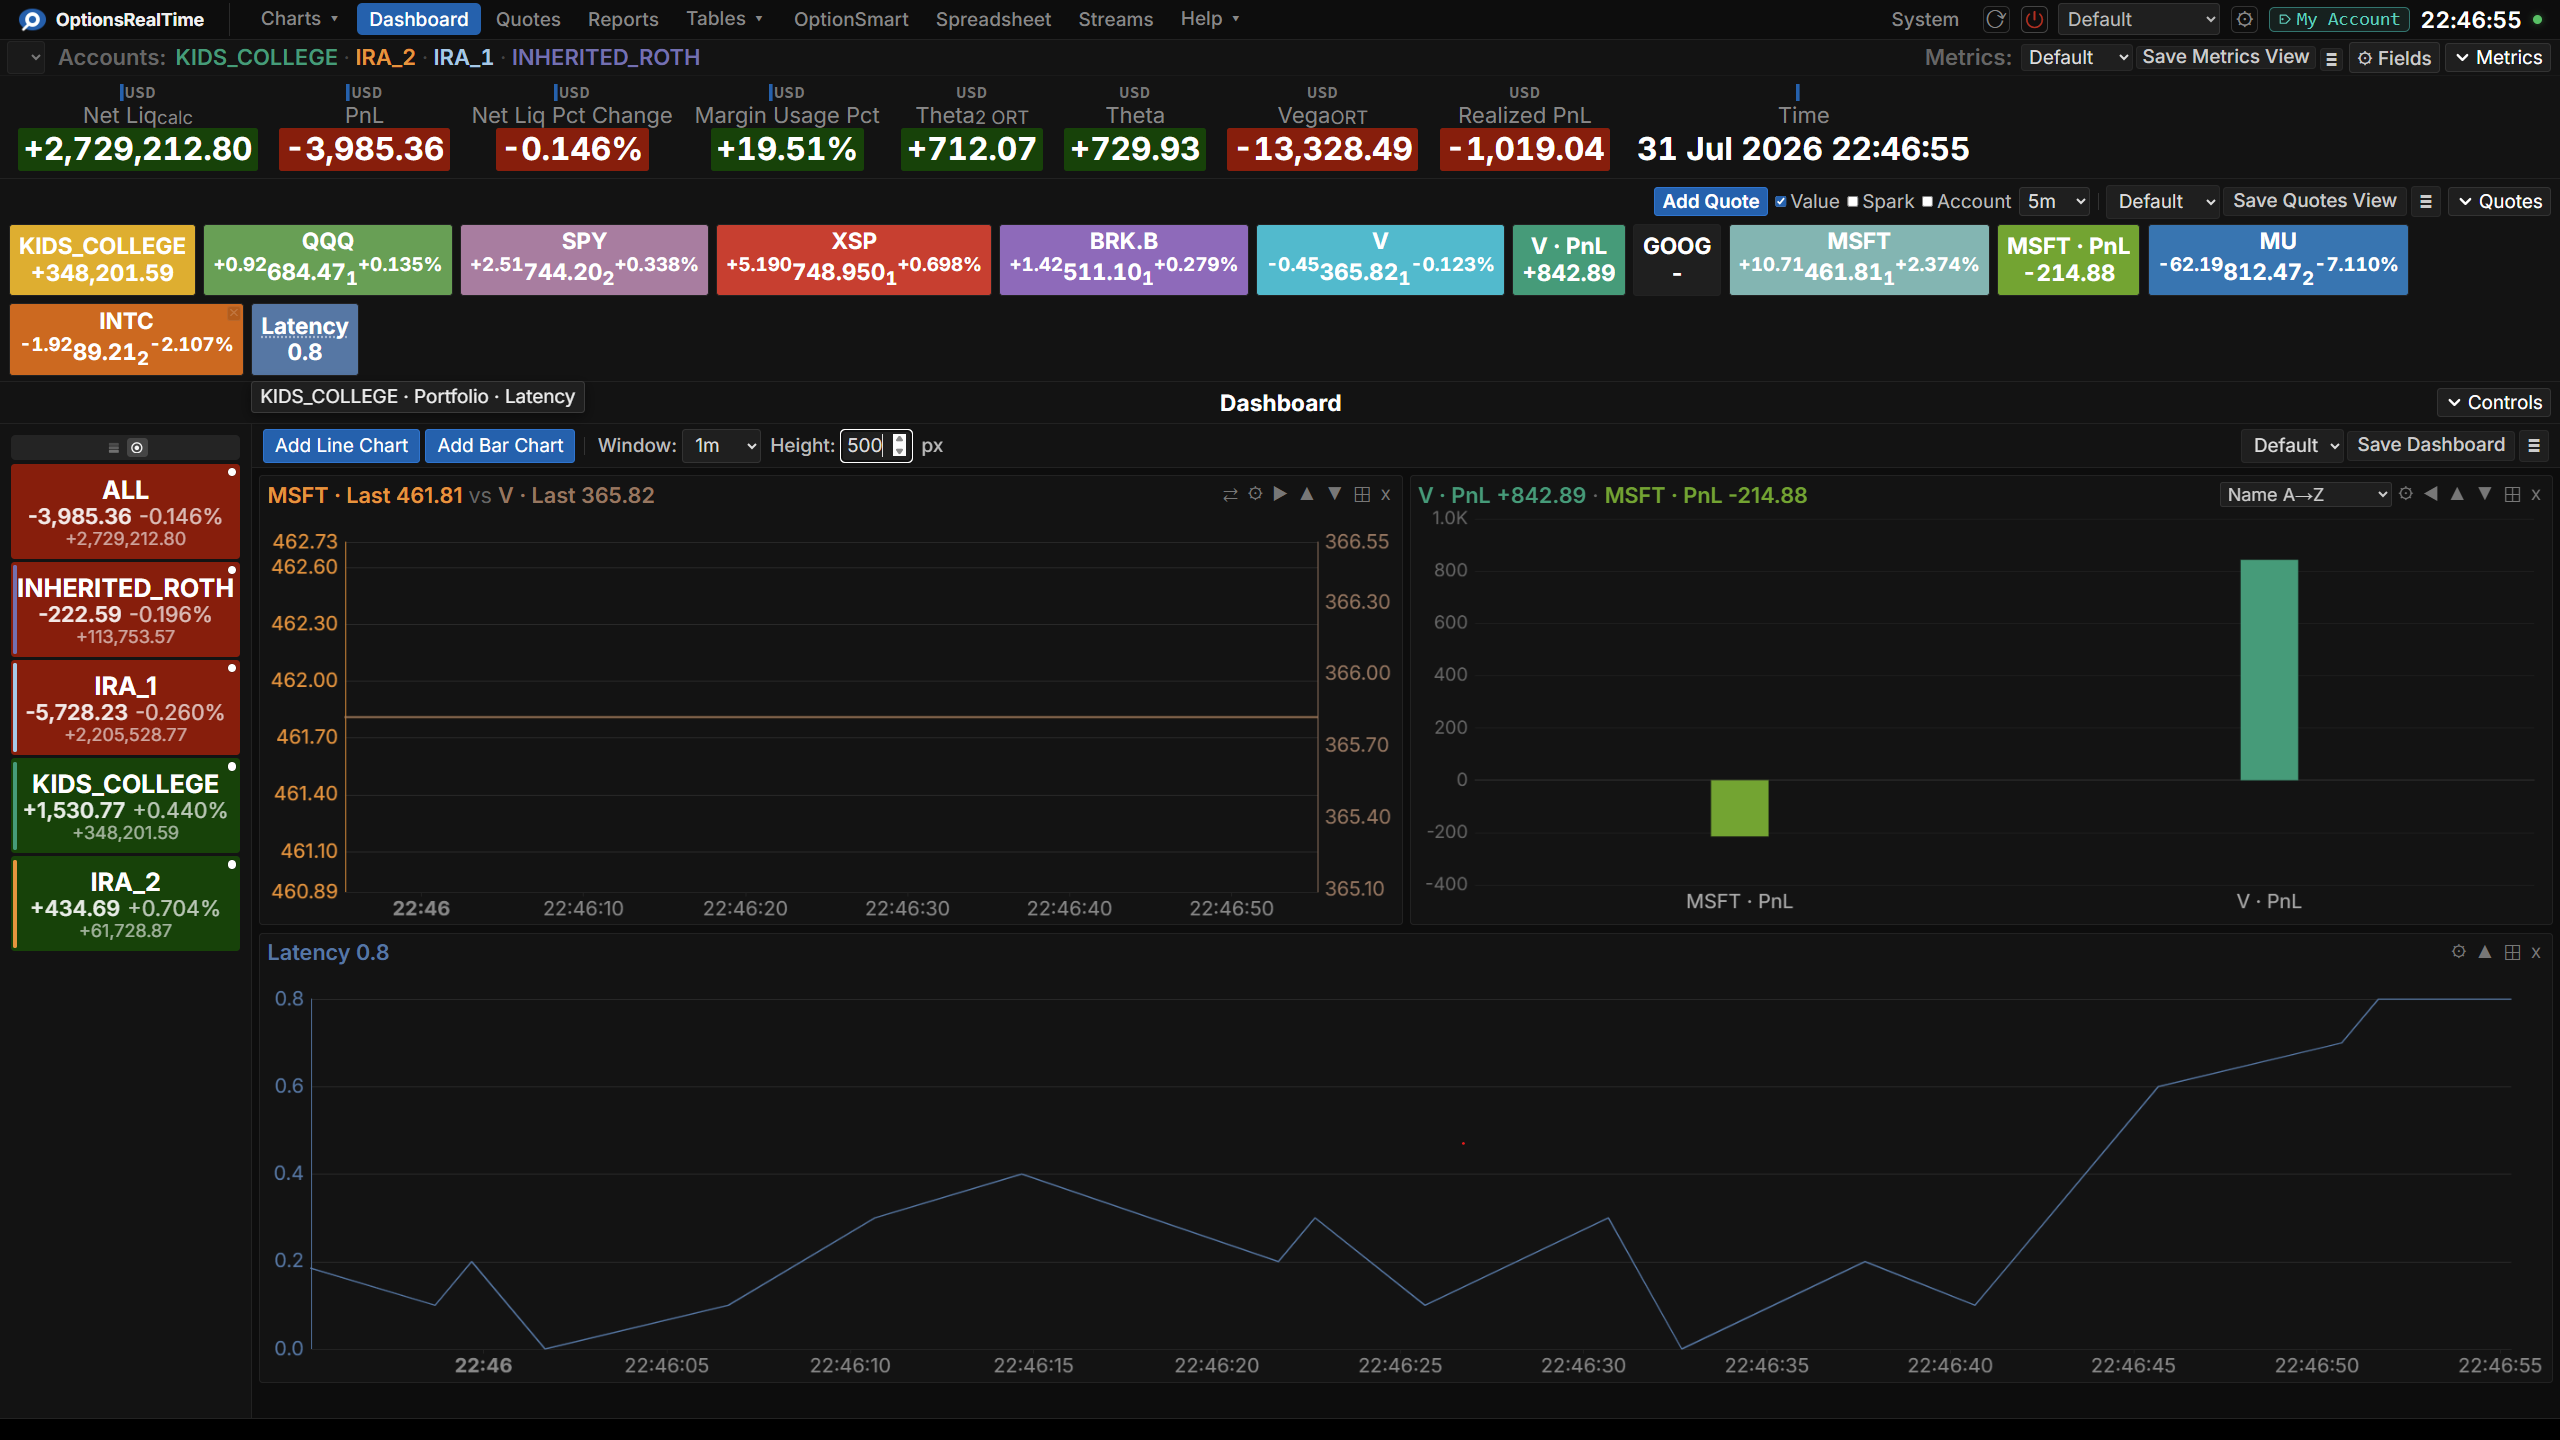
The Dashboard plots streams as line and bar charts. Charts are stacked in the component area and share a time range.
A stream has to exist before it can be charted. Streams are created on the Streams page.
Controls
Section titled “Controls”- Add Line Chart: open the stream picker for a new line chart
- Add Bar Chart: open the stream picker for a new bar chart
- Window: the time range every line chart covers, from the last minute upward
- Height: the height of each chart, in pixels
- View selector: switch between named dashboards
- Save Dashboard: save the current set of charts and their arrangement
- View Actions (hamburger menu): Reload, Save As, Rename, and Delete the current view (Rename and Delete are unavailable for the Default view)
The Controls row can be collapsed with the Controls chevron at the right of the page.
Line charts
Section titled “Line charts”Add Line Chart opens a picker listing the recordable streams with their current values, each with a checkbox and its color. A line chart takes one or two streams; the dialog header tracks the count. Add chart places it on the Dashboard.
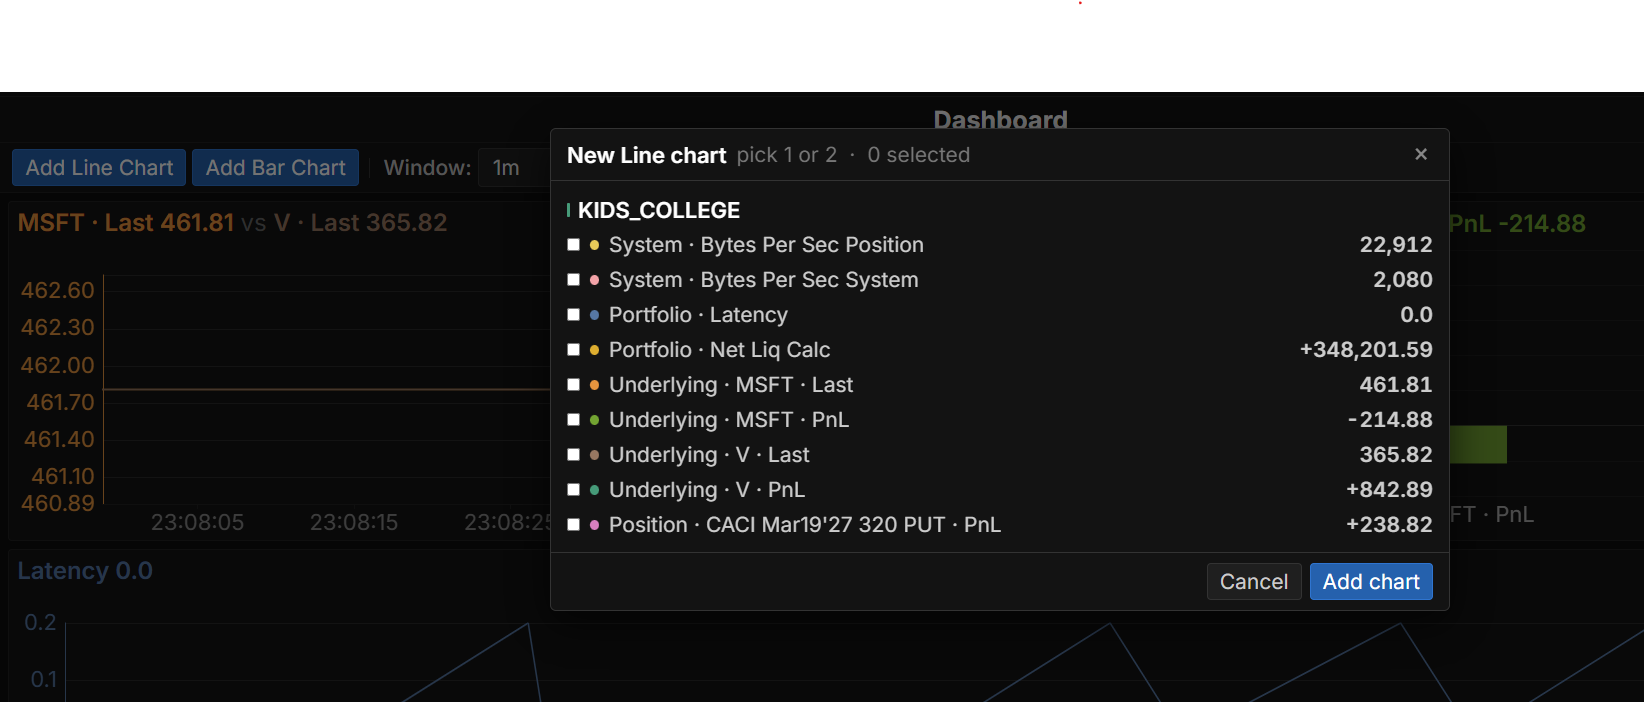
A chart plots history, so the picker lists only recordable streams: the ones whose field is a single number. Streams reading text or a combined quote are left out, and an account with no recordable streams does not appear.
With two streams, each gets its own Y axis, left and right, and the axis numbers are drawn in each line’s color to distinguish the two scales. The chart title reads A vs B, with the current value of each stream beside its name.
Hovering the chart shows a crosshair with the time and each line’s value at that point. Left-drag zooms a time range, right-drag pans, Ctrl or Cmd with the mouse wheel zooms to the cursor, and double-click resets to the current Window.
Bar charts
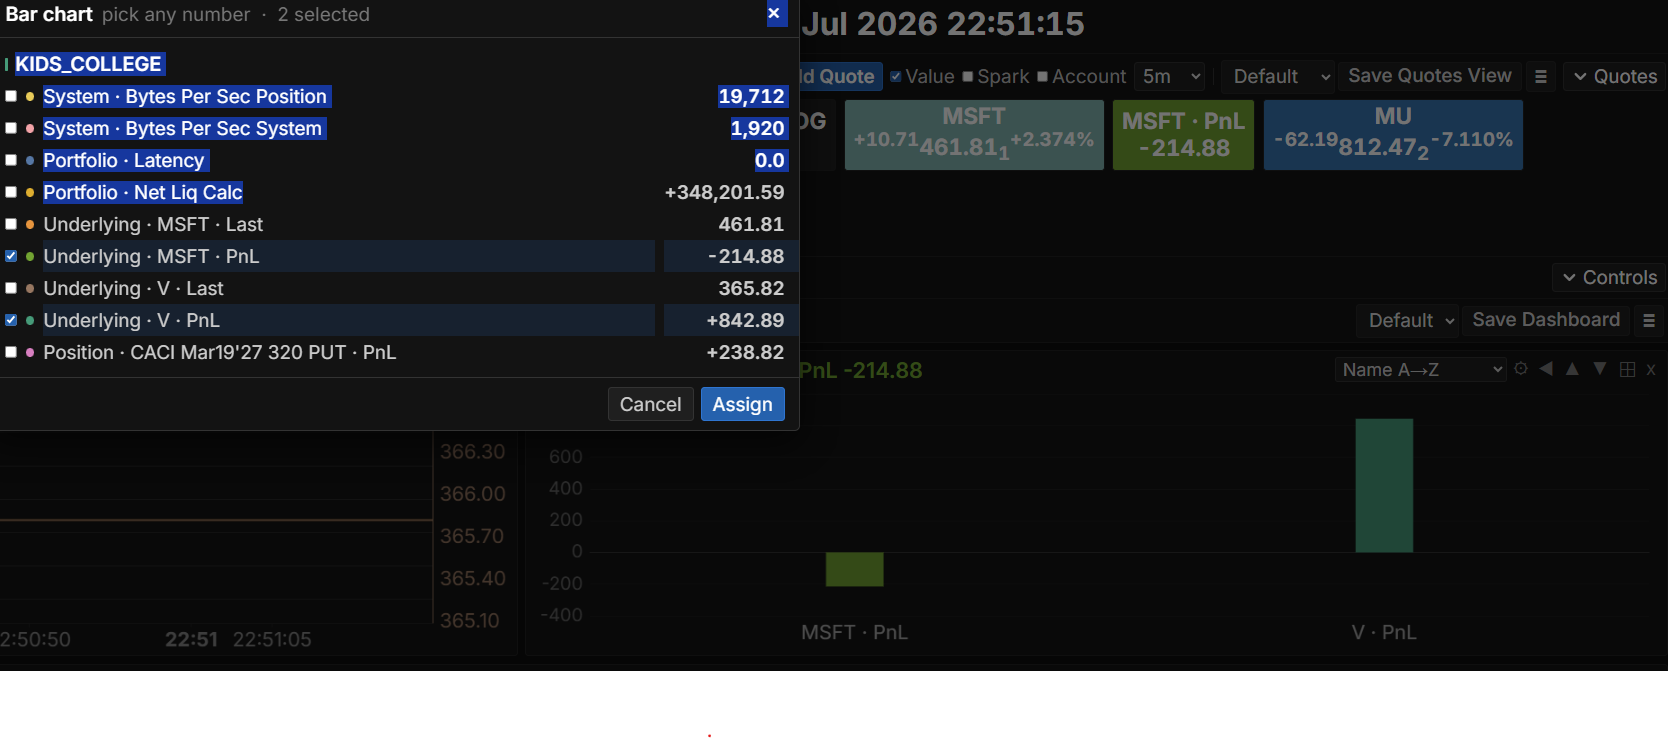
Section titled “Bar charts”Add Bar Chart opens the same picker, with the same recordable-only list, and a bar chart takes any number of streams.
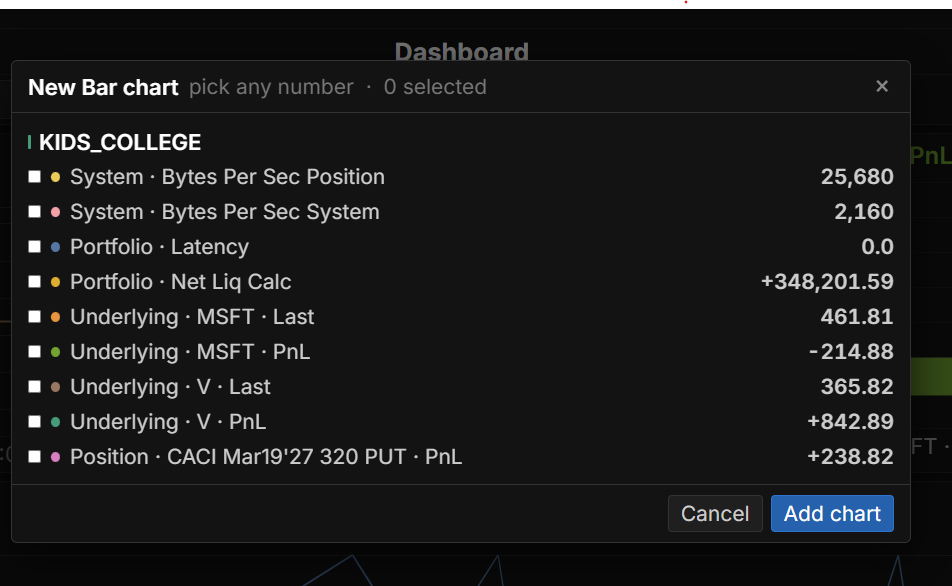
A bar chart shows one bar per stream, each in the stream’s color, at its current value. Negative values extend below the zero line. The chart header has a sort control, by value or by name and in either direction, applied on each update, so a value sort re-orders the bars as values change. Hovering a bar shows its name and value.
Chart header
Section titled “Chart header”A chart’s header carries its title on the left and its controls on the right. Which controls appear depends on the chart.

- Swap: exchange the left and right Y axes. Two-stream line charts only.
- Settings: reopen the stream picker for the chart (see below).
- Move arrows: reposition the chart among the others. Only the usable directions are shown, so the leftmost chart has no left arrow and the last chart has no down arrow.
- Maximize: expand the chart to fill the component area; click again to restore.
- x: remove the chart.
A bar chart also carries its sort control here.
Changing a chart’s streams
Section titled “Changing a chart’s streams”The settings button reopens the picker with the chart’s current streams already checked. The header reads Line chart or Bar chart, and the button reads Assign rather than Add chart.
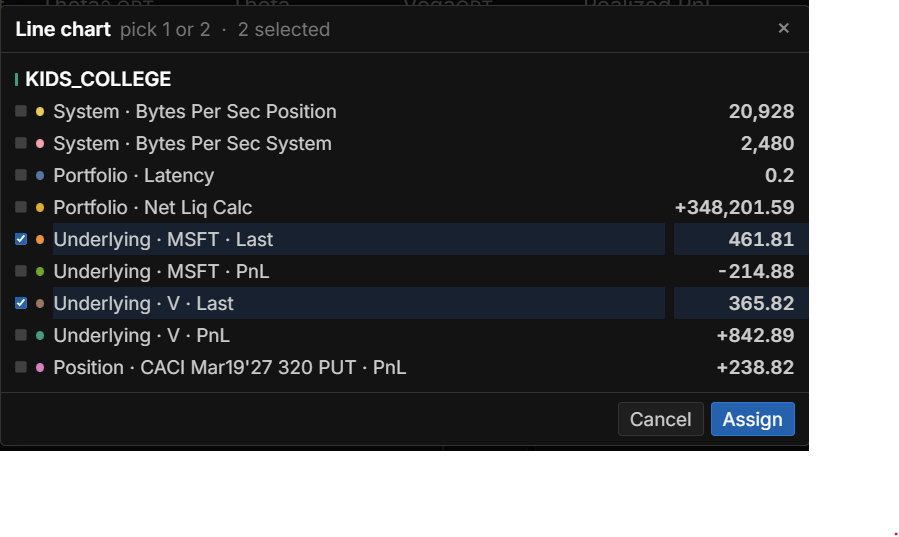
Assigning replaces what the chart plots. The chart keeps its position and its size.
Window and zoom
Section titled “Window and zoom”The Window control sets the shared time range for every line chart. Zooming a single chart detaches it from the shared Window; selecting a Window preset returns all charts to that range.
A chart draws from a stream’s recorded history, so it fills in from the point recording started rather than showing history from before that.
Saving
Section titled “Saving”Saving the Dashboard stores the charts, the streams in each, their order, and the Window and Height settings. Definitions are written only on an explicit Save, so an unsaved edit does not overwrite the saved layout.
Recorded history is stored on the server, so loading a Dashboard on another machine on the network restores both the charts and the recorded data behind them.