Tables
OptionsRealTime presents data in four real-time tables. Each table has a standard component toolbar for view management and column selection. The contents reflect the accounts selected in the account selector. Most tables include a Total row at the top that sums values for metrics that support aggregation: PnL, Net Liq Value, Theta, Vega, Delta Dollars, and more.
| Table | Description |
|---|---|
| Position | Per-position detail with full Greeks and metrics |
| Underlying | Data aggregated by underlying, plus underlying-specific metrics |
| Portfolio | Account-level balances and summary metrics |
| System | Data streaming health and connection diagnostics |
Toolbar
Section titled “Toolbar”All tables share a standard toolbar:
- View selector: switch between named configurations
- Save: save the current configuration; the button label reflects the active table (Save Position View, Save Underlying View, Save Portfolio View, Save System View)
- View Actions (hamburger menu): Reload, Save As, Rename, and Delete the current view (Rename and Delete are unavailable for the Default view)
- Columns: open the column picker side panel
- Auto Size: auto-fit all column widths to cell contents
- Font size: controls the size of table text
The Position Table adds a Filter button that opens the Position Filter panel. The Underlying Table adds additional controls described below.
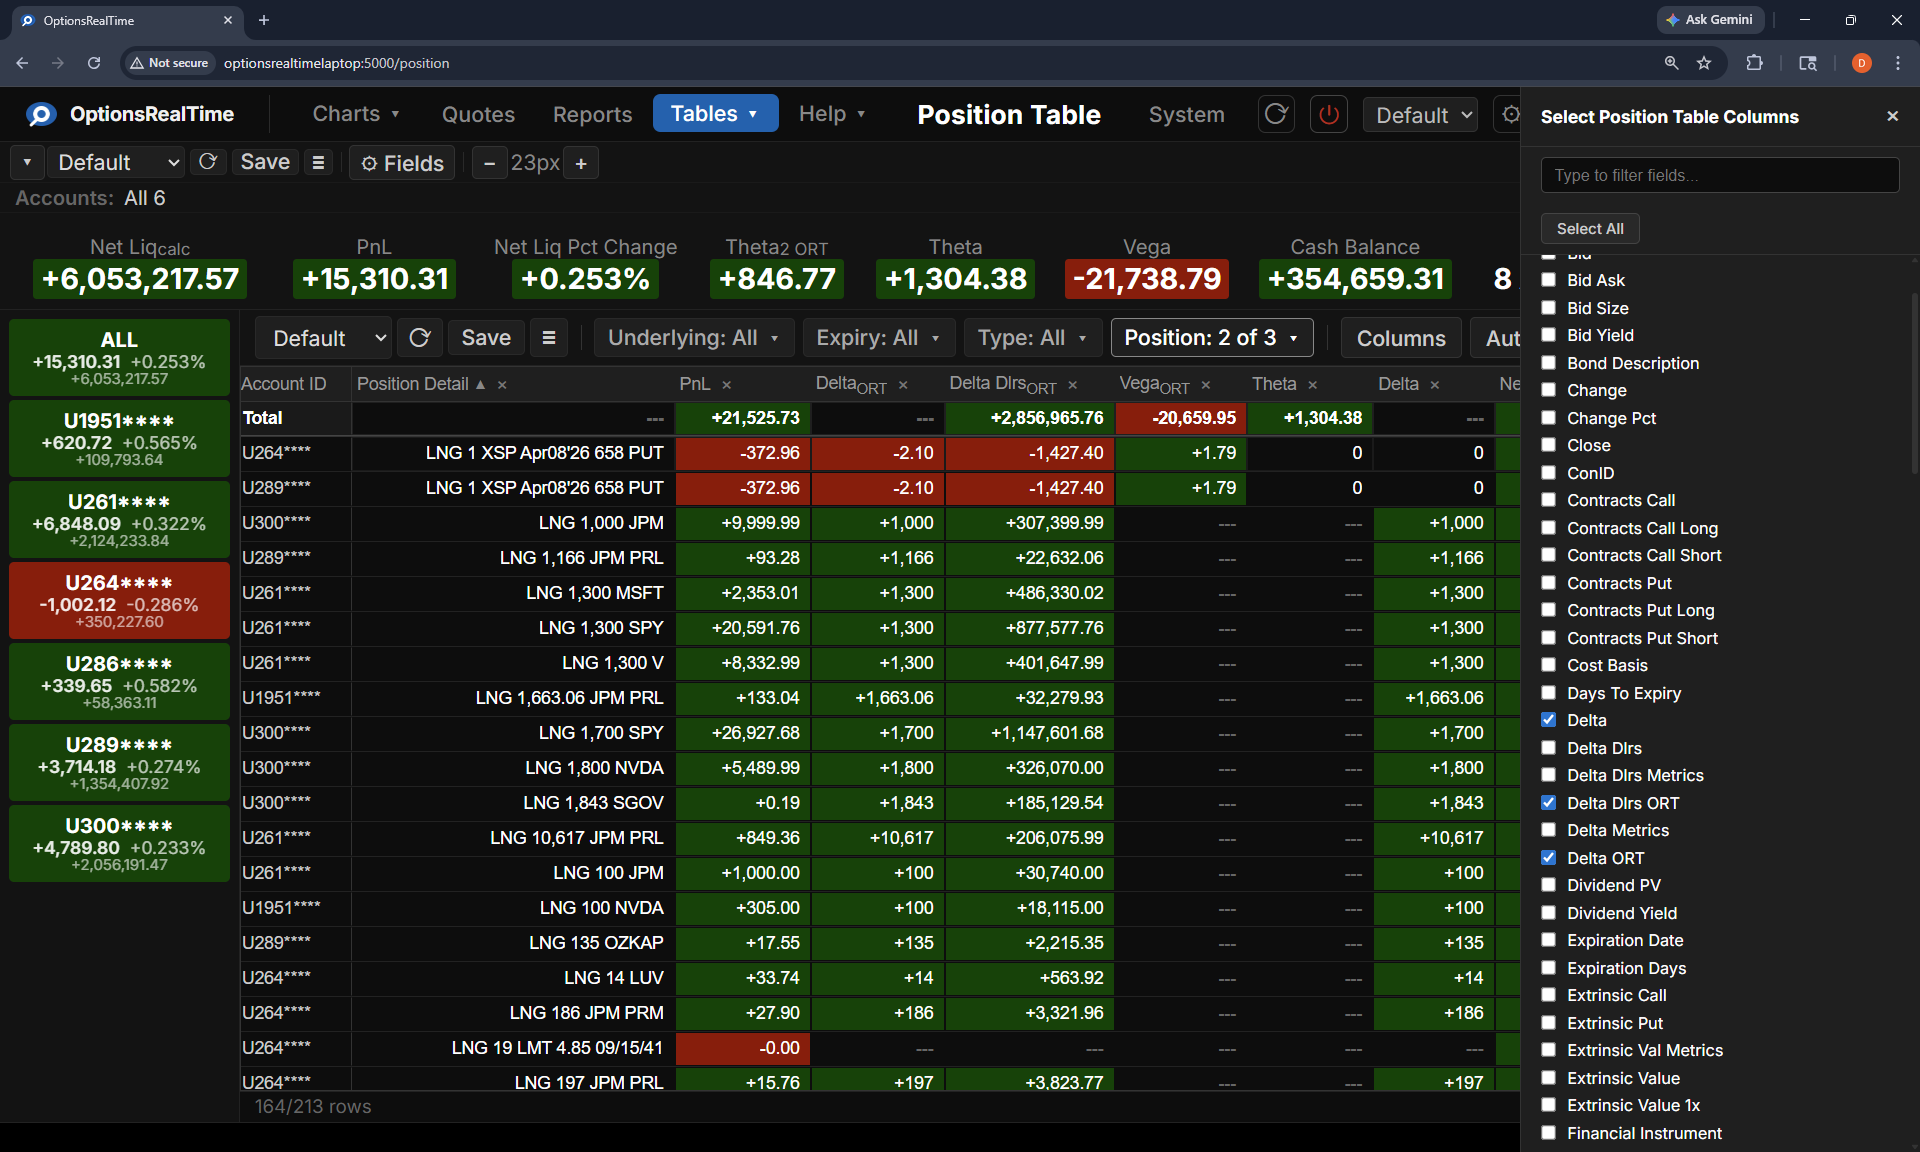
Position Table
Section titled “Position Table”The Position Table displays per-position detail for every individual security in the portfolio. Each row represents a single position with its market data, Greeks, and calculated metrics.
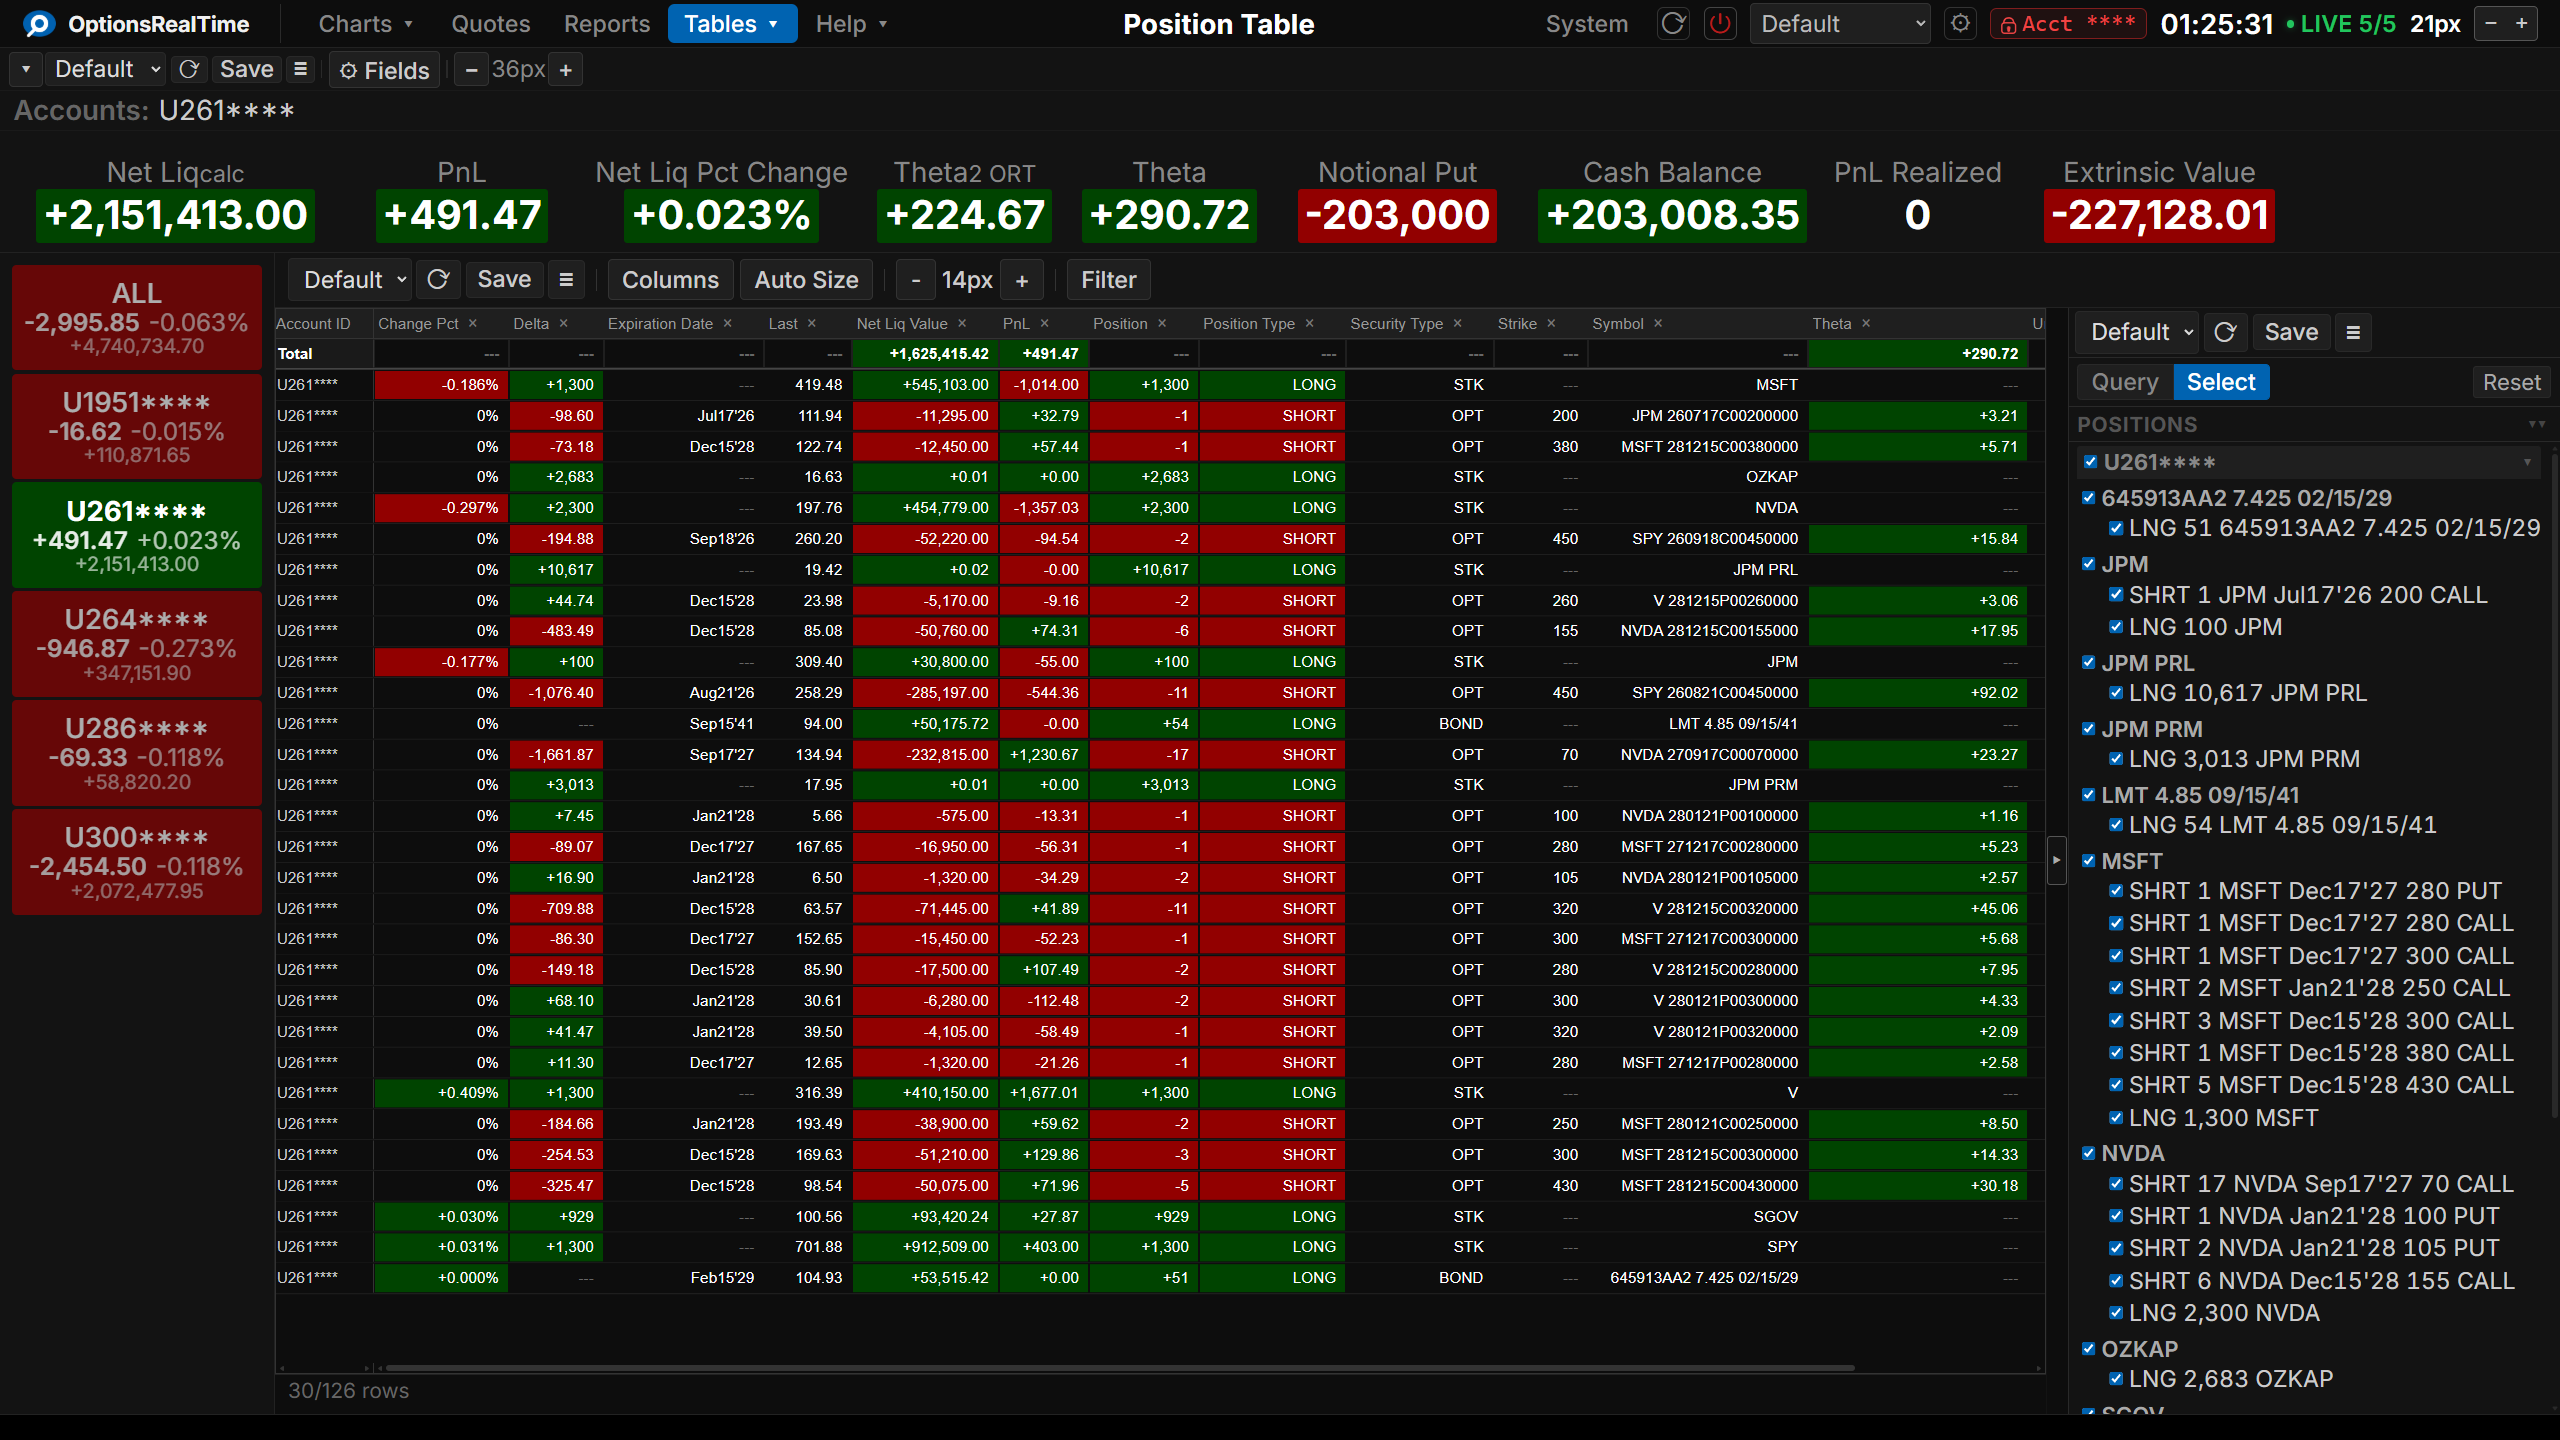
Position Filter
Section titled “Position Filter”This table supports the Position Filter, a right-side panel that narrows the table to a chosen subset of positions. Toggle it with the Filter button in the toolbar. A filter selector narrows the selection by any combination of underlyings, type, side, or expiry, which can then be refined in the panel.
Underlying Table
Section titled “Underlying Table”The Underlying Table shows data aggregated by underlying. Metrics that can be summed (Delta, Theta, Vega, PnL, etc.) are aggregated across all positions for each underlying. The table also includes underlying-specific data such as the current quote, change, and percent change.
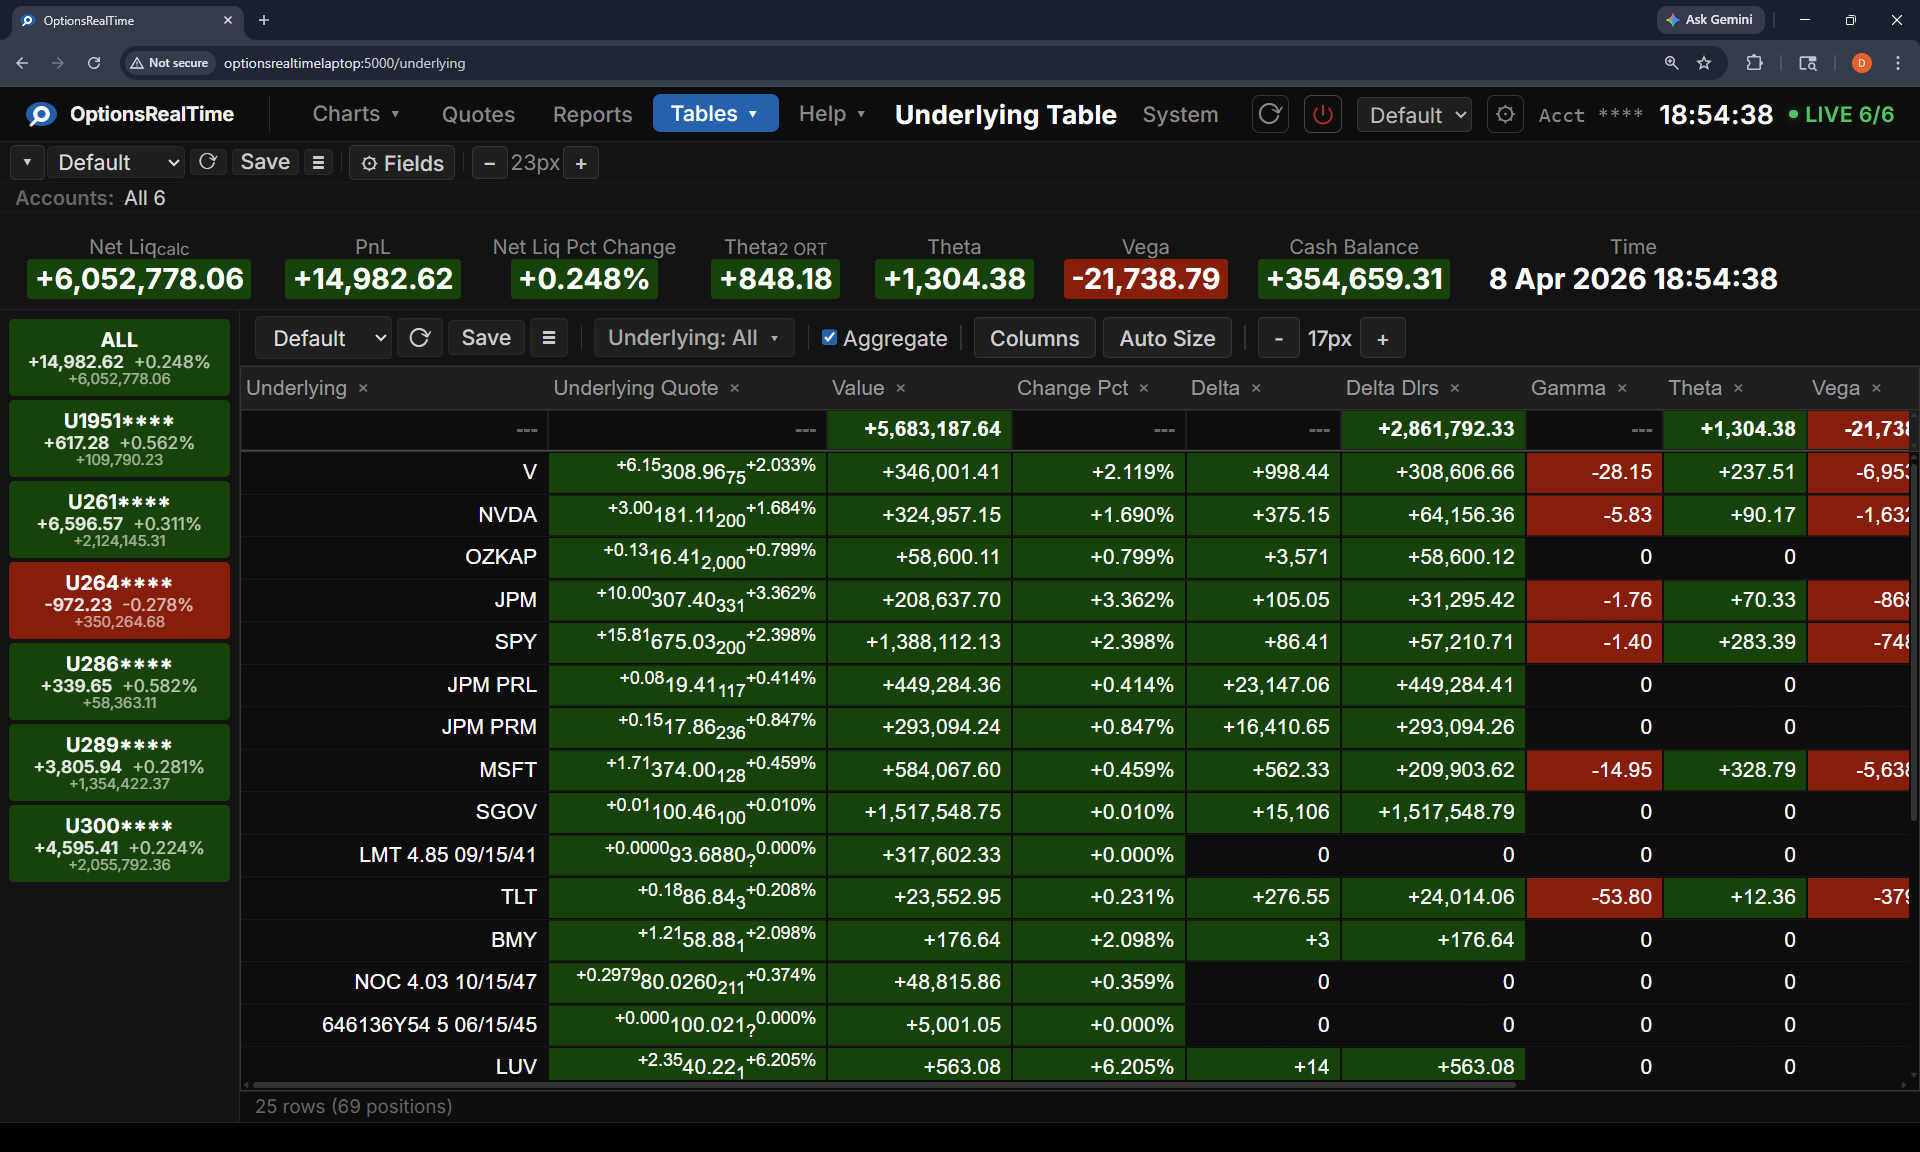
In addition to the standard toolbar, the Underlying Table includes:
- Underlying: filter by one or more underlying symbols
- Aggregate: toggle row aggregation across selected accounts
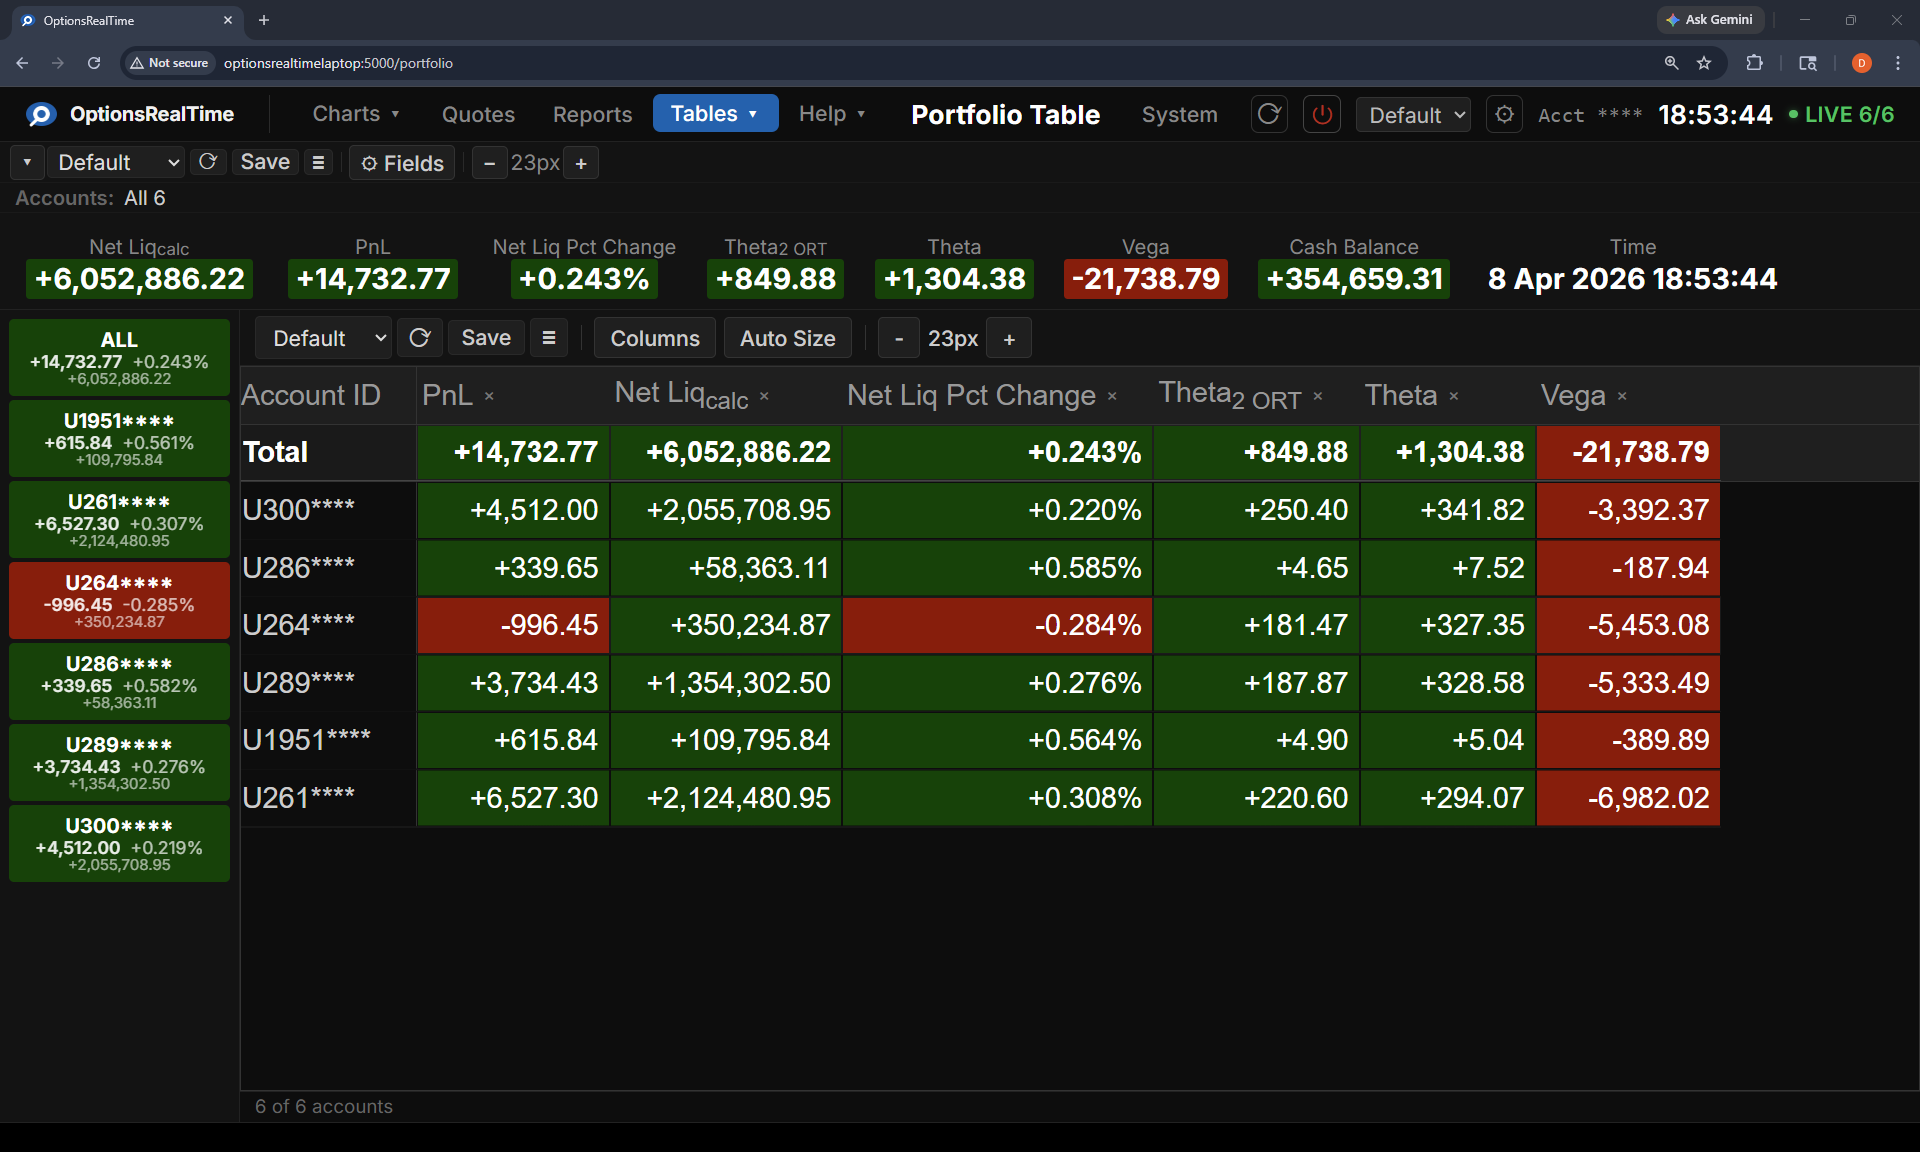
Portfolio Table
Section titled “Portfolio Table”The Portfolio Table contains account-level data including net liquidation value, PnL, percent change, Greeks totals, cash balance, and other portfolio summary metrics. Each row represents one account, with a Total row at the top.
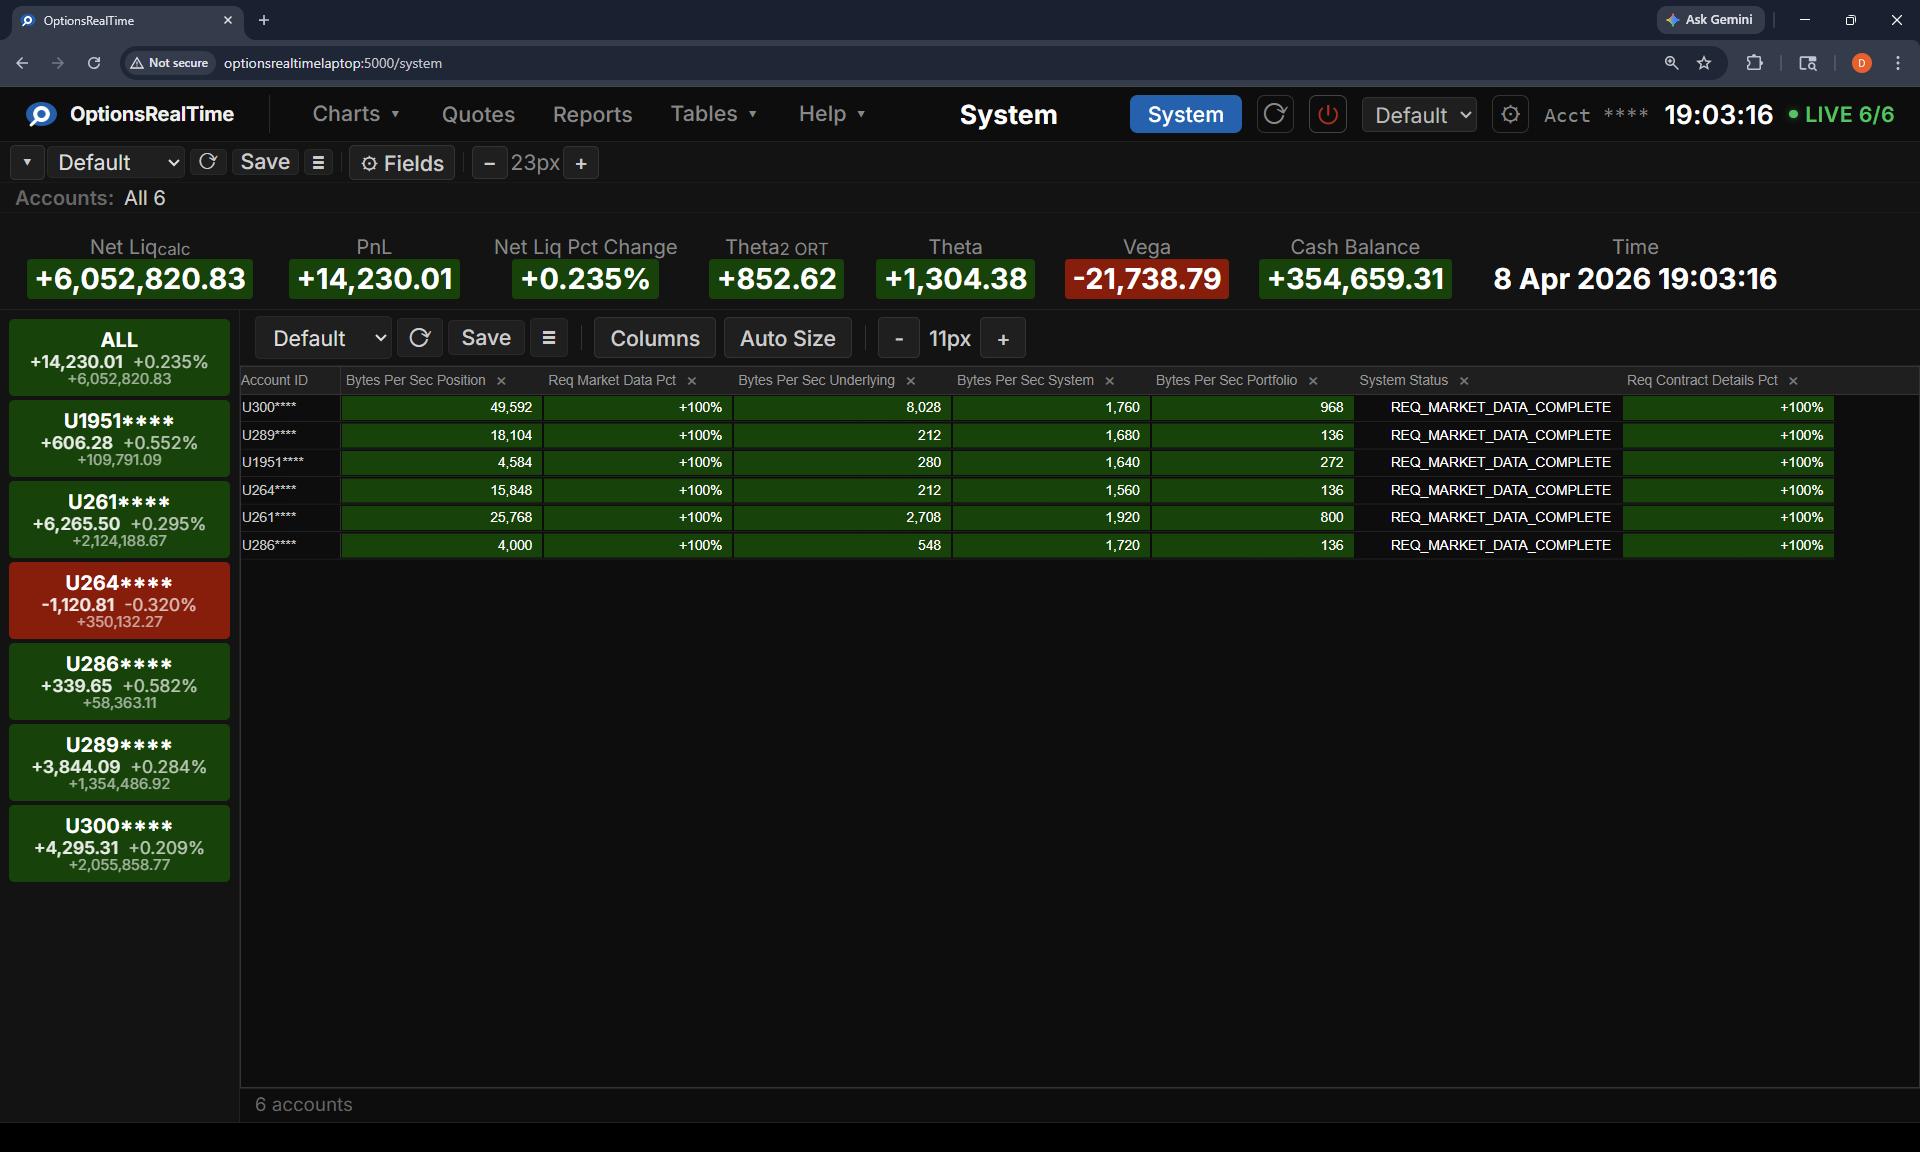
System Table
Section titled “System Table”The System Table displays data for monitoring system internals and data integrity. Each row represents one account with metrics such as bytes per second, request rates, system status, and request completion status. Useful for diagnosing data flow and connection issues. The System Table has no Total row since its metrics are not summable.
Column Selection
Section titled “Column Selection”Clicking Columns in the toolbar opens a side panel listing every available column for the table with a checkbox. Checked columns appear in the table. A search box at the top filters the list by column name. Column selection is saved with the table view.
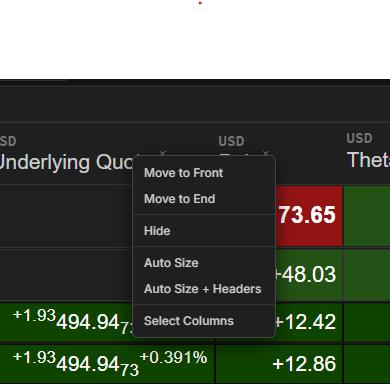
Column Menu
Section titled “Column Menu”Right-clicking a column header opens a menu of column actions:
- Move to Front: move the column to the beginning of the table
- Move to End: move the column to the end of the table
- Hide: remove the column from the table
- Auto Size: size the column to fit its contents
- Select Columns: open the Columns side panel
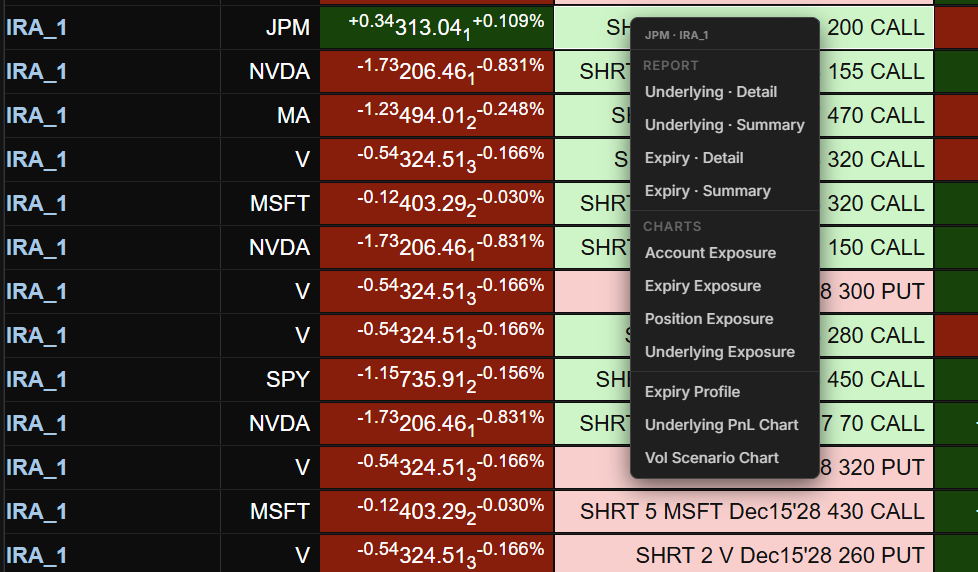
Row Menu
Section titled “Row Menu”Right-clicking a row opens a menu that navigates to a Report or Chart page using the row as context. The menu header shows the context that will be passed.
| Table | Context |
|---|---|
| Position | Account and underlying from the clicked row |
| Underlying | Underlying from the clicked row, applied across all selected accounts |
| Portfolio | Account from the clicked row |
Position and Underlying menus group destinations into two sections:
- Report: Underlying · Detail, Underlying · Summary, Expiry · Detail, Expiry · Summary
- Charts: Underlying PnL Chart, Underlying Exposure, Account Exposure, Position Exposure, Vol Scenario Chart, Expiry Profile Chart
The Portfolio menu has a layout suited to account-level navigation:
- View in Report: Underlying · Detail, Underlying · Summary, Expiry · Detail, Expiry · Summary
- Quotes: Quotes
- Charts: Underlying PnL Chart, Portfolio PnL Chart, Underlying Exposure, Account Exposure, Expiry Profile Chart
Sorting
Section titled “Sorting”Click any column header to sort the table by that column. Click again to reverse the sort order.