Tables
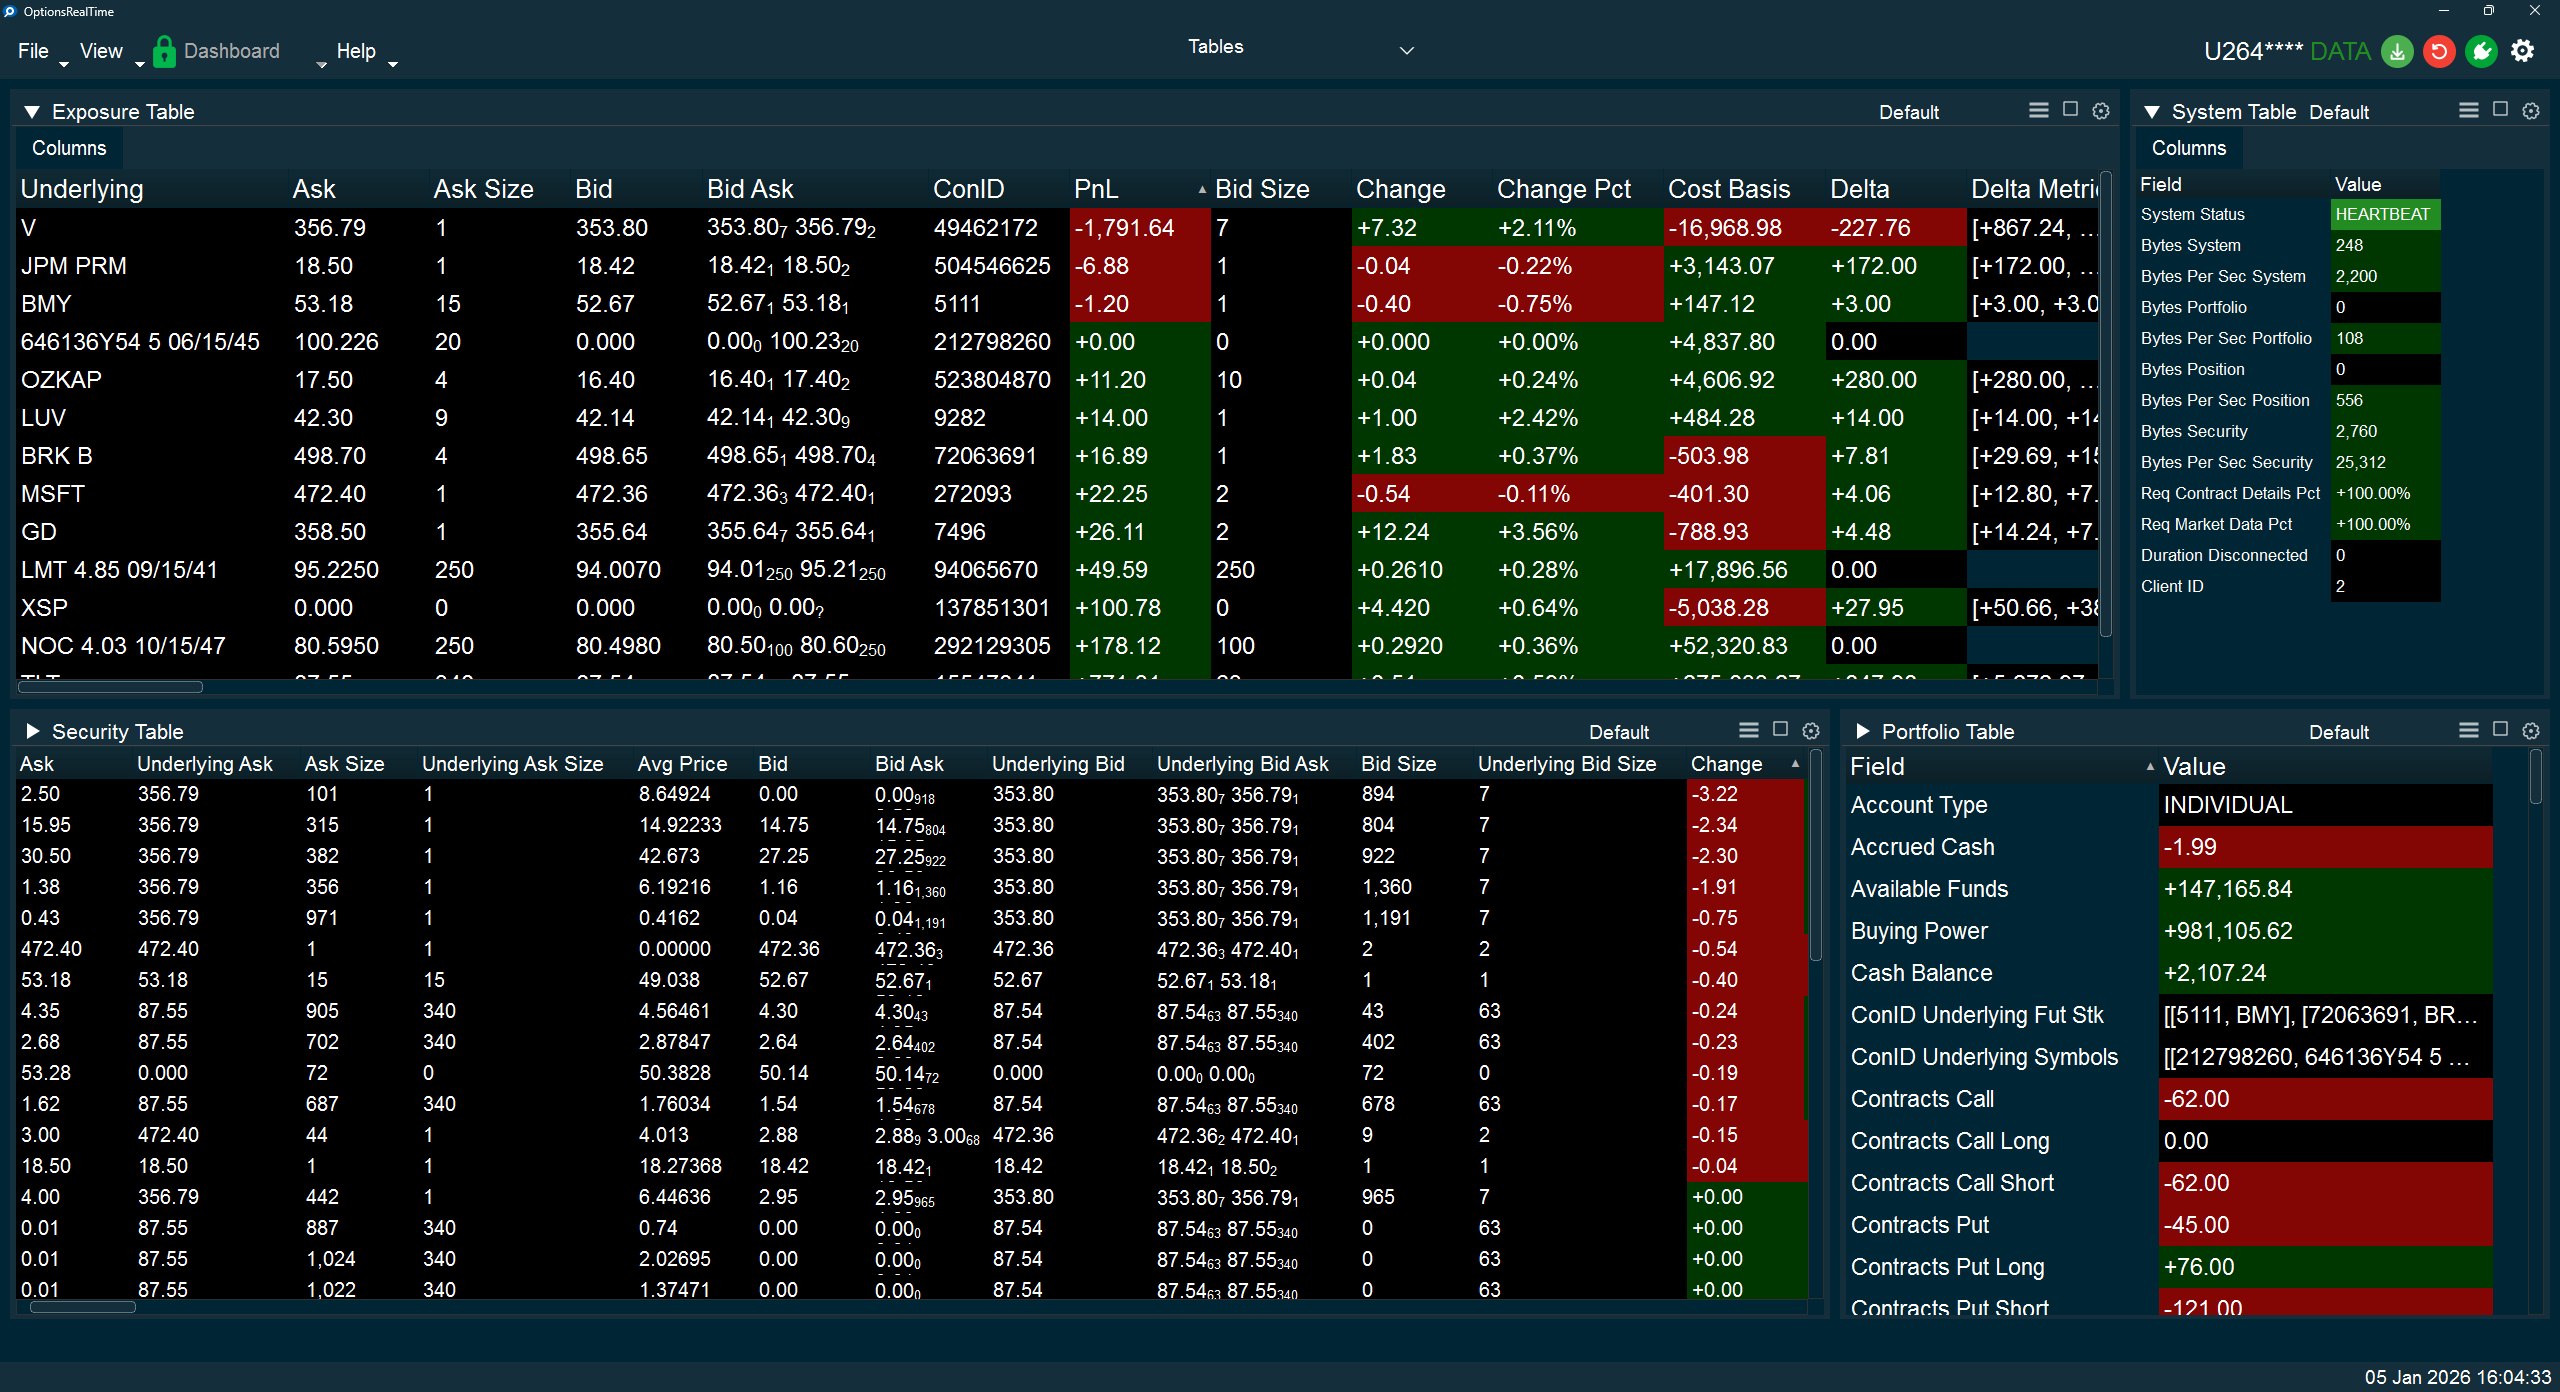
The fundamental technical backbone of OptionsRealTime is grounded in distributed real-time tables. All data is sent in the form of tables. Cells may contain any data type: text, numbers, HTML, 2D or 3D arrays, or any other data structure.
Publishers broadcast their internal data tables to subscribers such as user interfaces (Excel, the desktop app, or even a browser) which maintain a synchronized mirror image of its source. From these tables, receivers can present data in any format: charts, quotes, reports, or as raw tables.
Tables are not limited by the number of rows or fields (columns) they contain. Currently, every account contains four tables:
| Table | Description |
|---|---|
| Security | Per-position data for every security in the portfolio |
| Exposure | Data aggregated by underlying, plus underlying-specific metrics |
| Portfolio | Portfolio-level account data and summary metrics |
| System | System monitoring, data integrity, and connection diagnostics |
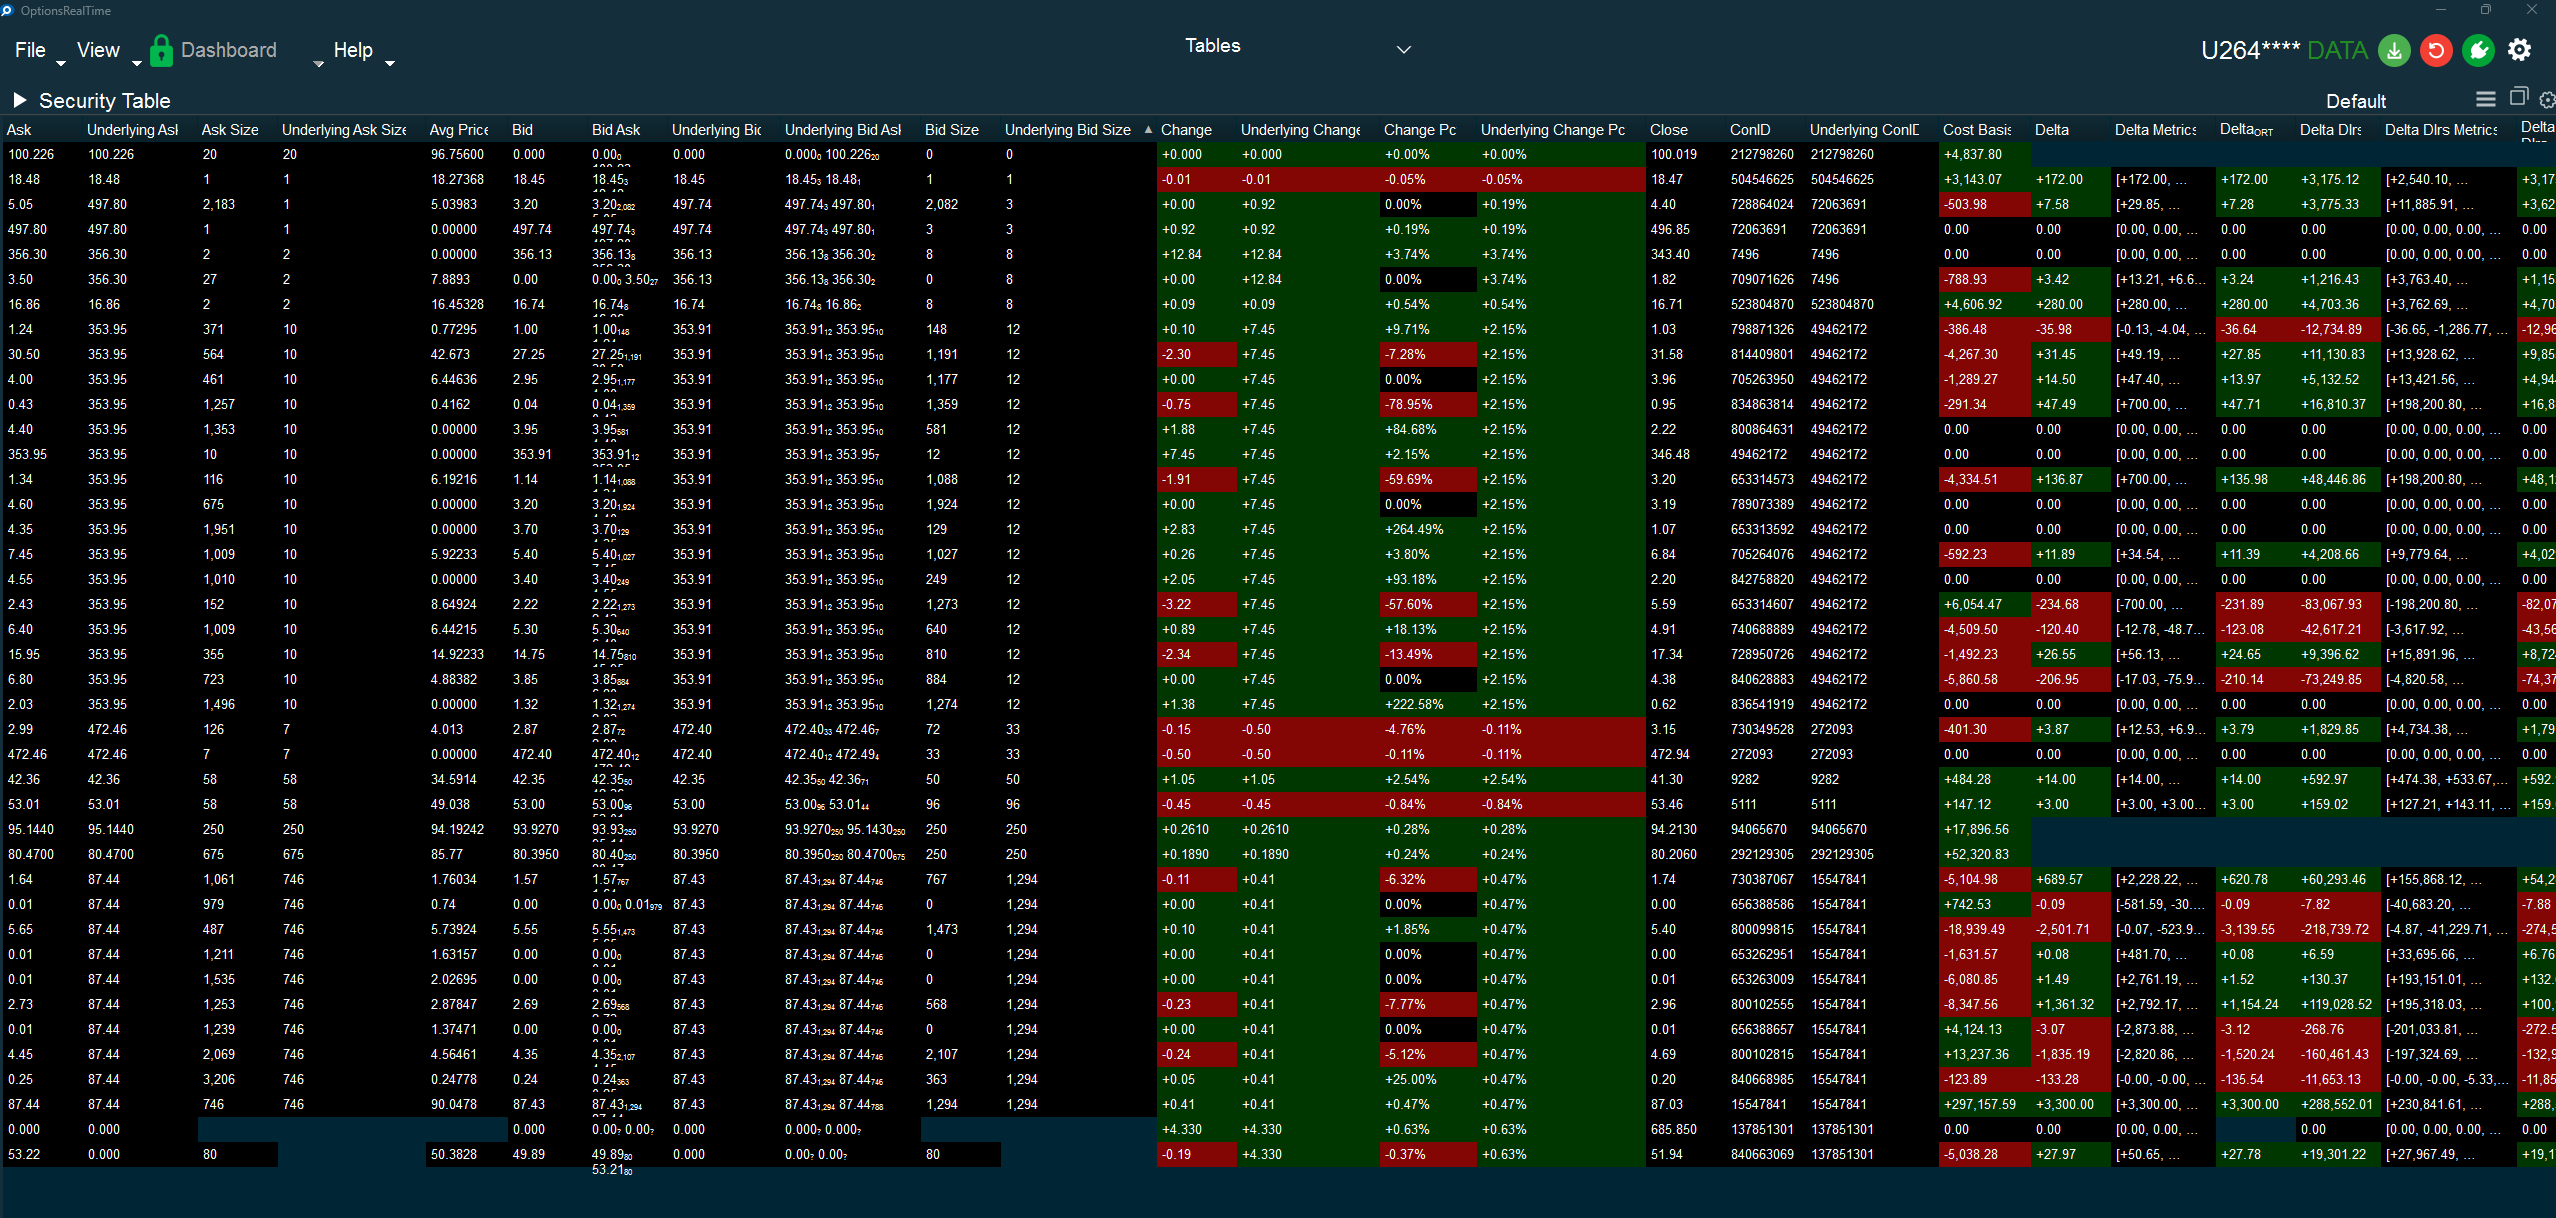
Security Table
Section titled “Security Table”The Security Table displays per-position data for every individual security in the portfolio. Each row represents a single position with its associated market data, Greeks, and calculated metrics.
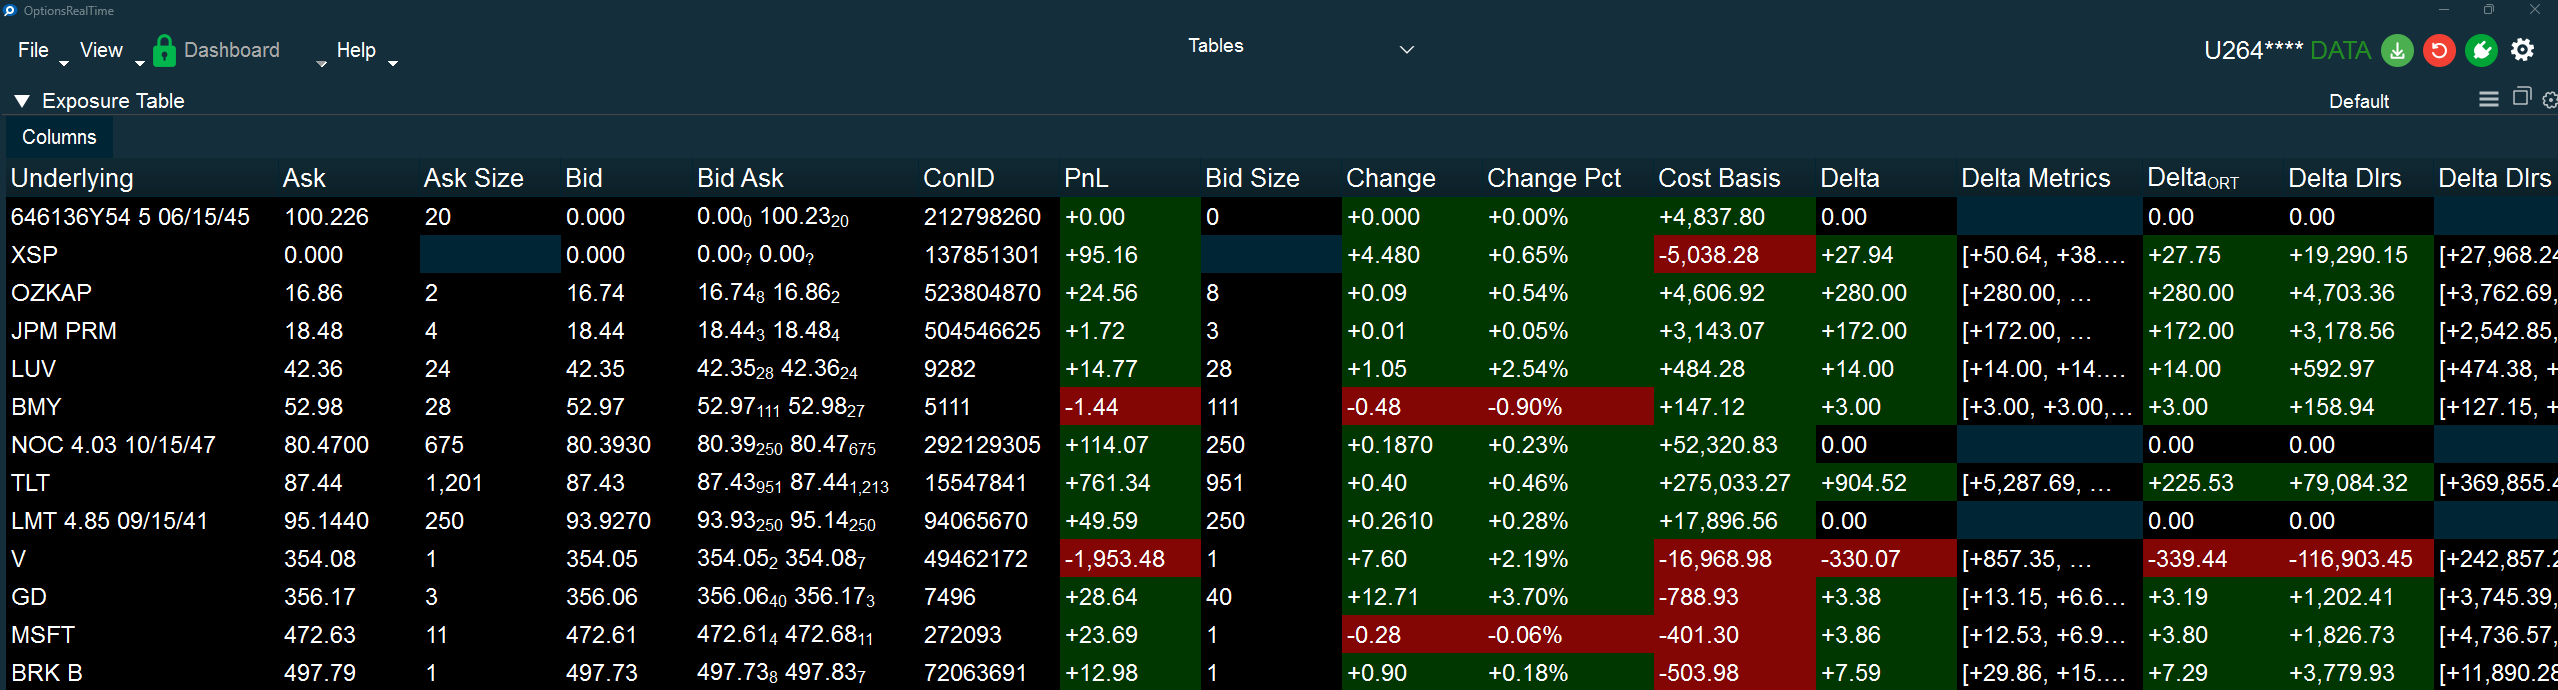
Exposure Table
Section titled “Exposure Table”The Exposure Table shows data aggregated by underlying. Metrics that can be summed or rolled up (such as Delta, Theta, PnL) are aggregated across all positions for each underlying. It also includes underlying-specific data such as the underlying’s current price and market data.
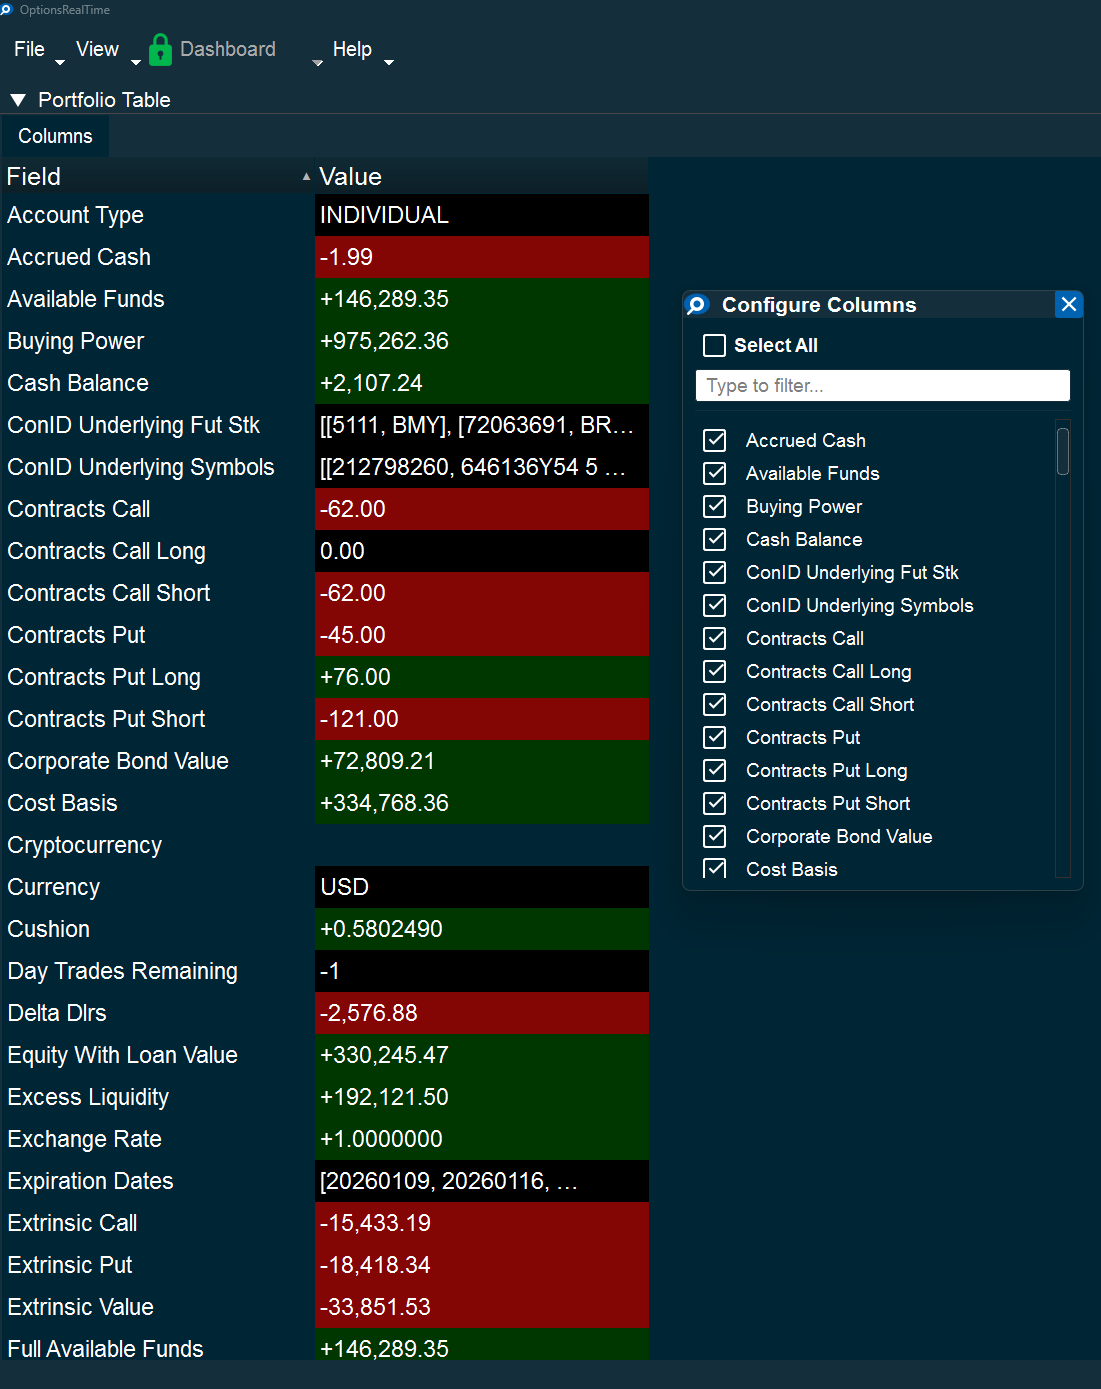
Portfolio Table
Section titled “Portfolio Table”The Portfolio Table contains portfolio-level data including account balances, buying power, margin requirements, and aggregate portfolio metrics. This table provides a comprehensive view of account status.
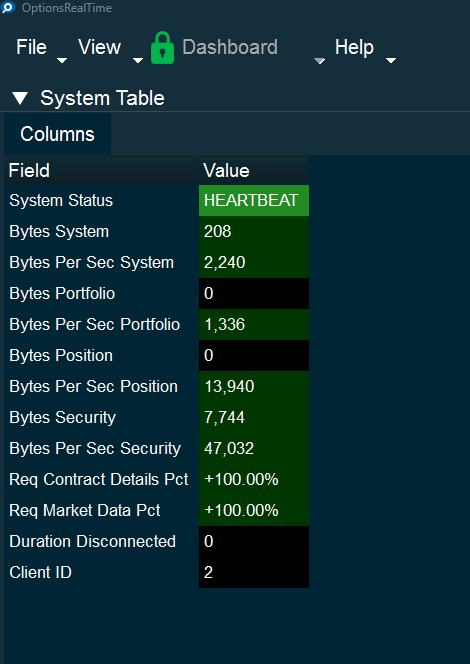
System Table
Section titled “System Table”The System Table displays data for monitoring the internals and integrity of the system. This includes connection status, data flow rates, heartbeat information, and diagnostic metrics useful for troubleshooting.
Common Features
Section titled “Common Features”All tables share common functionality:
Column Configuration
Section titled “Column Configuration”Click the Columns button in the upper left corner to open the Configure Columns dialog. This allows:
- Selecting which columns to display
- Filtering columns by name
- Select All / Deselect All toggles
Sorting
Section titled “Sorting”Click any column header to sort by that column. Click again to reverse sort order.
Data Colors
Section titled “Data Colors”Values display with positive (green), negative (red), or flat colors based on Dashboard Data Color settings.
Mouse Controls
Section titled “Mouse Controls”- Mouse Wheel: Scroll vertically through rows
- Ctrl + Shift + Mouse Wheel: Zoom in and out
- Horizontal Scroll: Scroll horizontally to view additional columns
Keyboard Controls
Section titled “Keyboard Controls”When the table has focus:
| Action | Shortcut |
|---|---|
| Scroll up | ↑ |
| Scroll down | ↓ |
| Scroll left | ← |
| Scroll right | → |
Examples
Section titled “Examples”