Reports
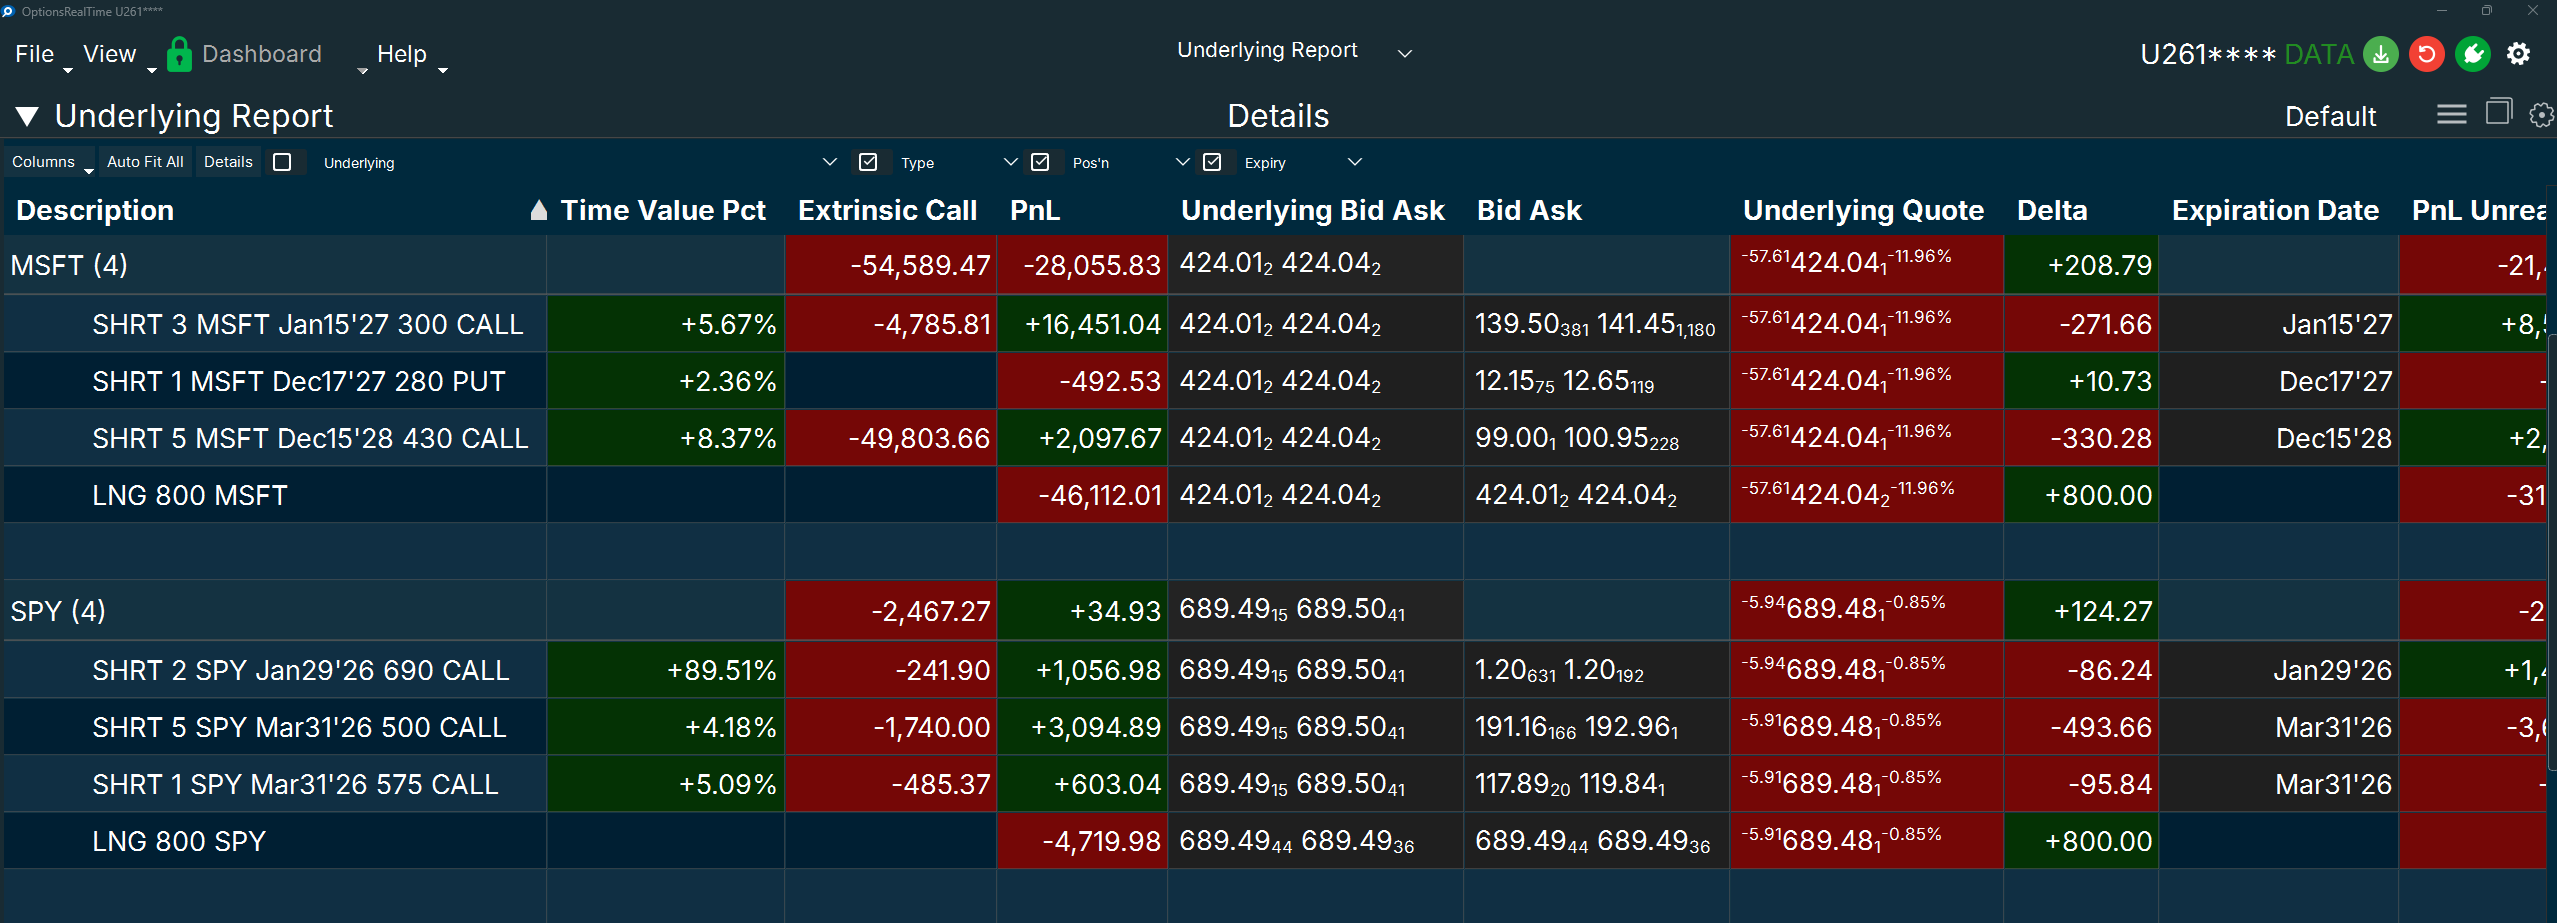
Reports show positions grouped by a chosen dimension. Two report types are available:
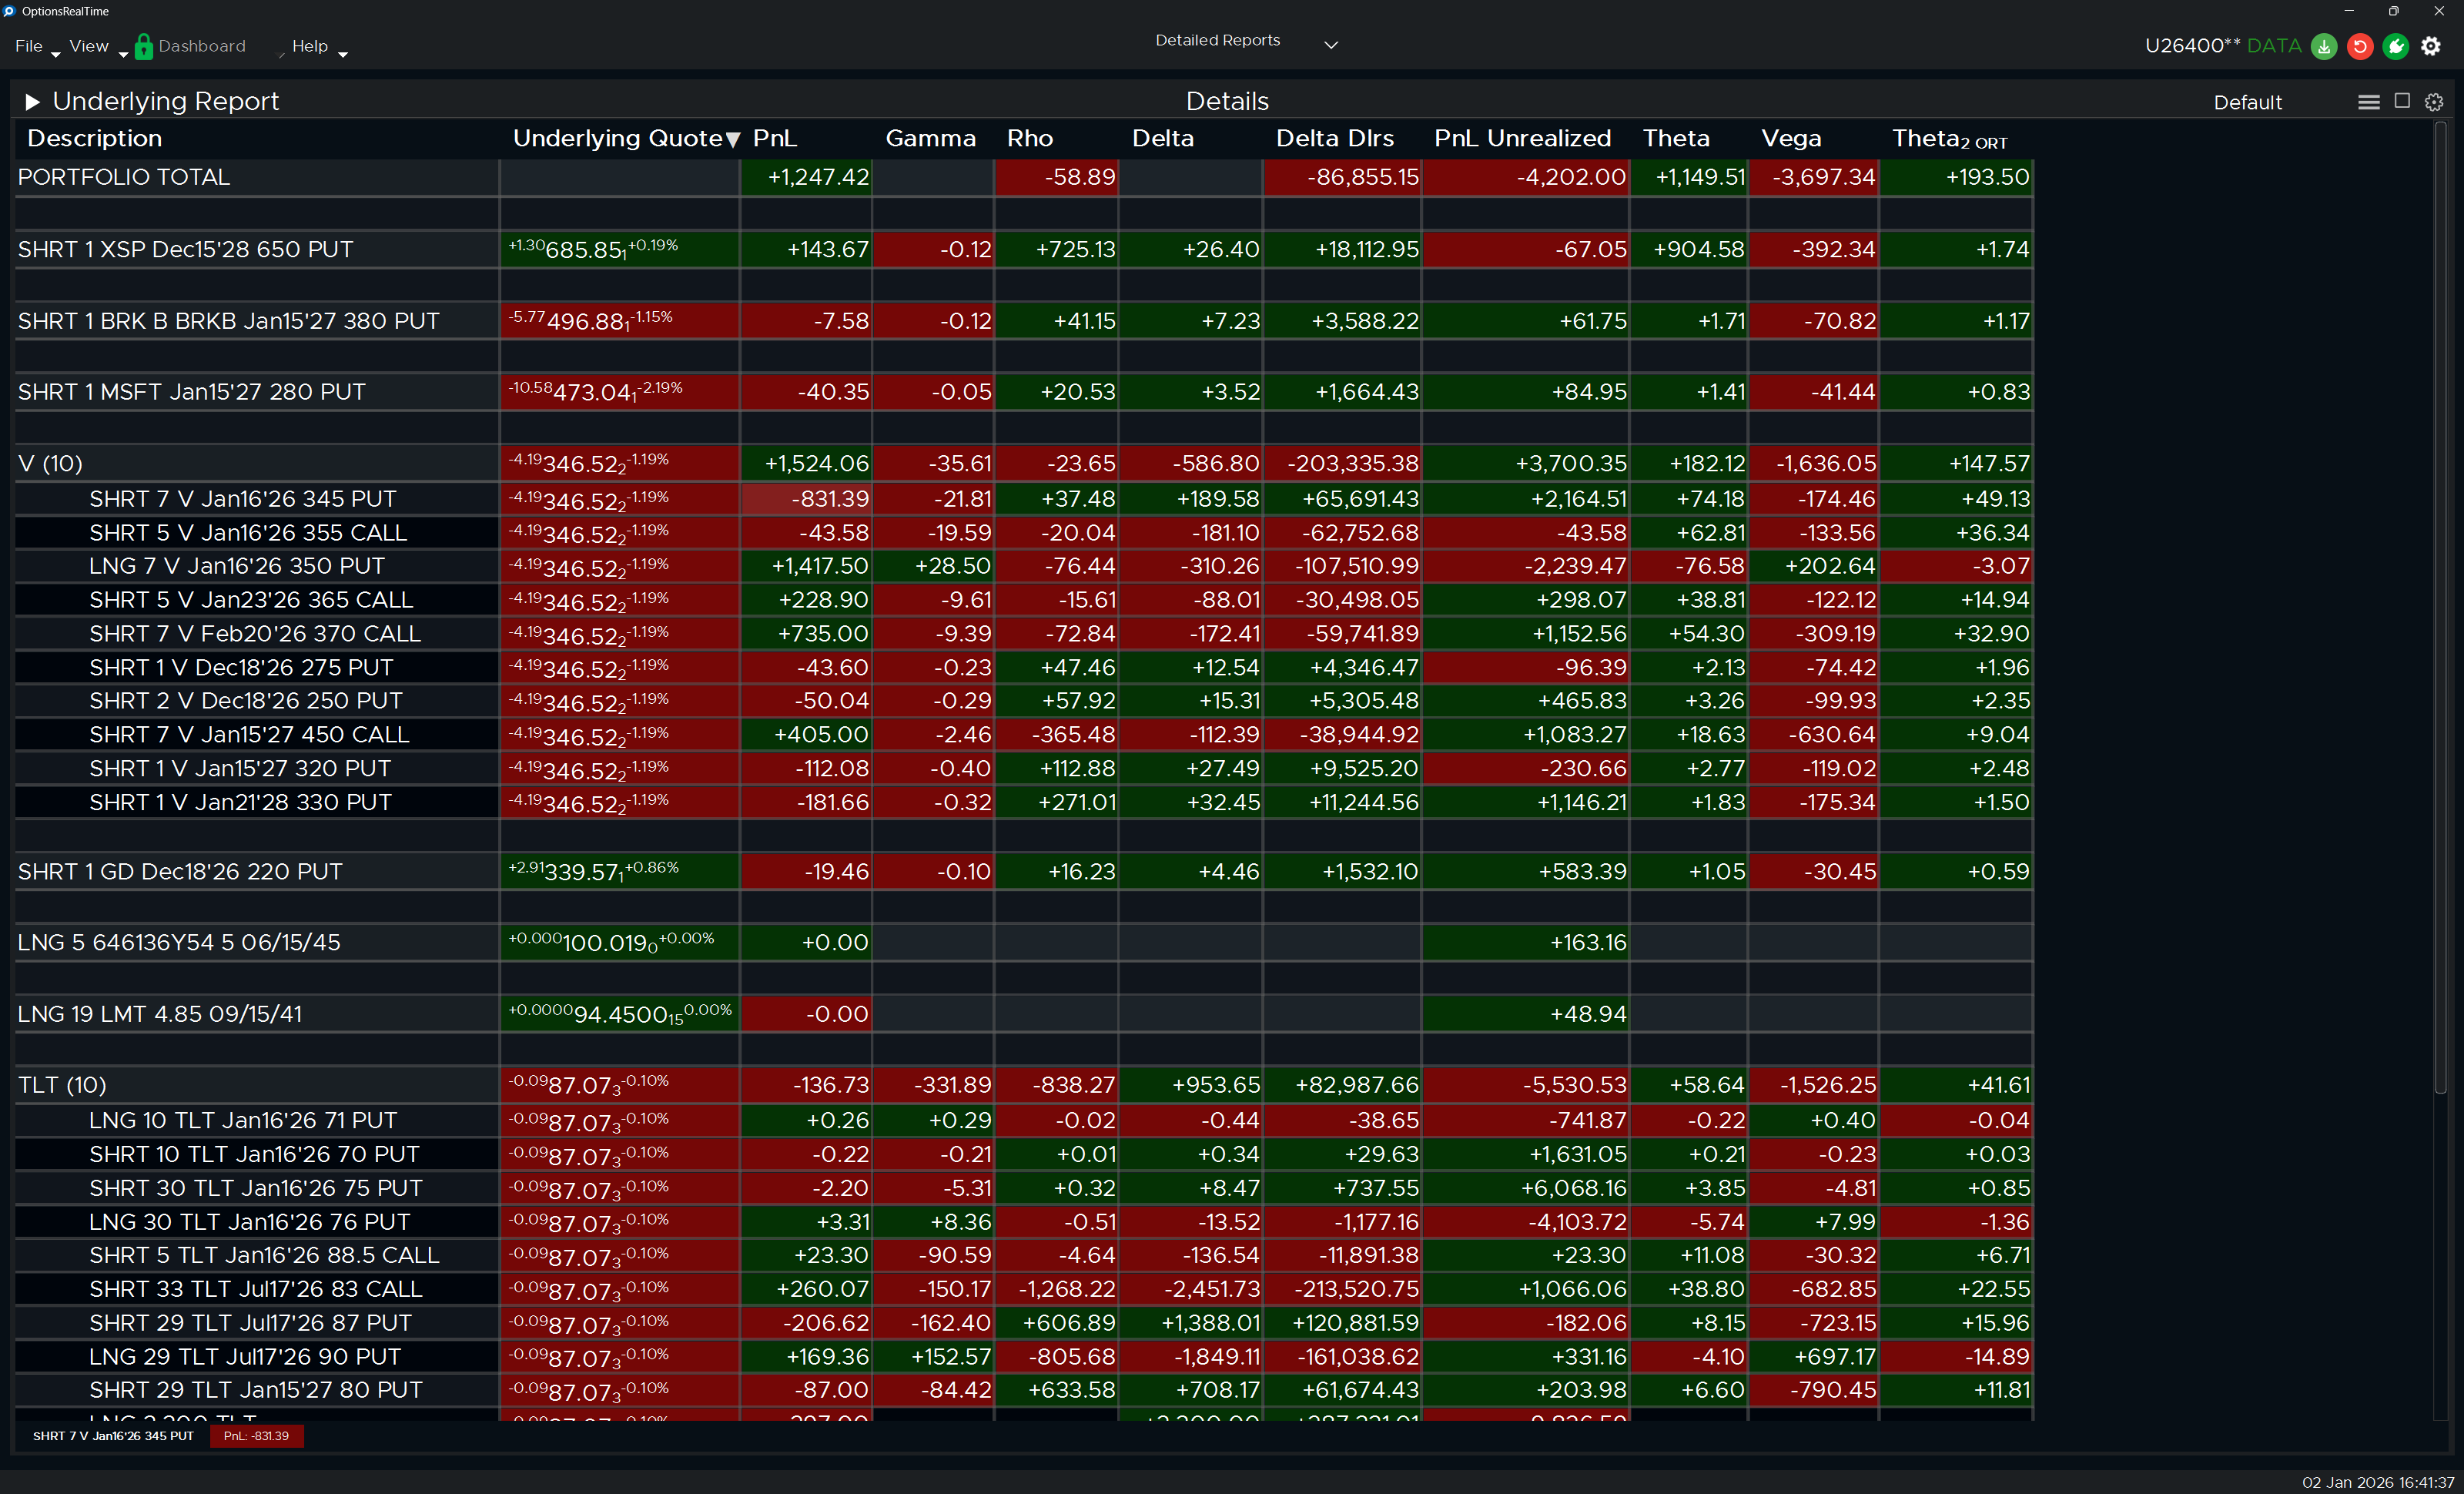
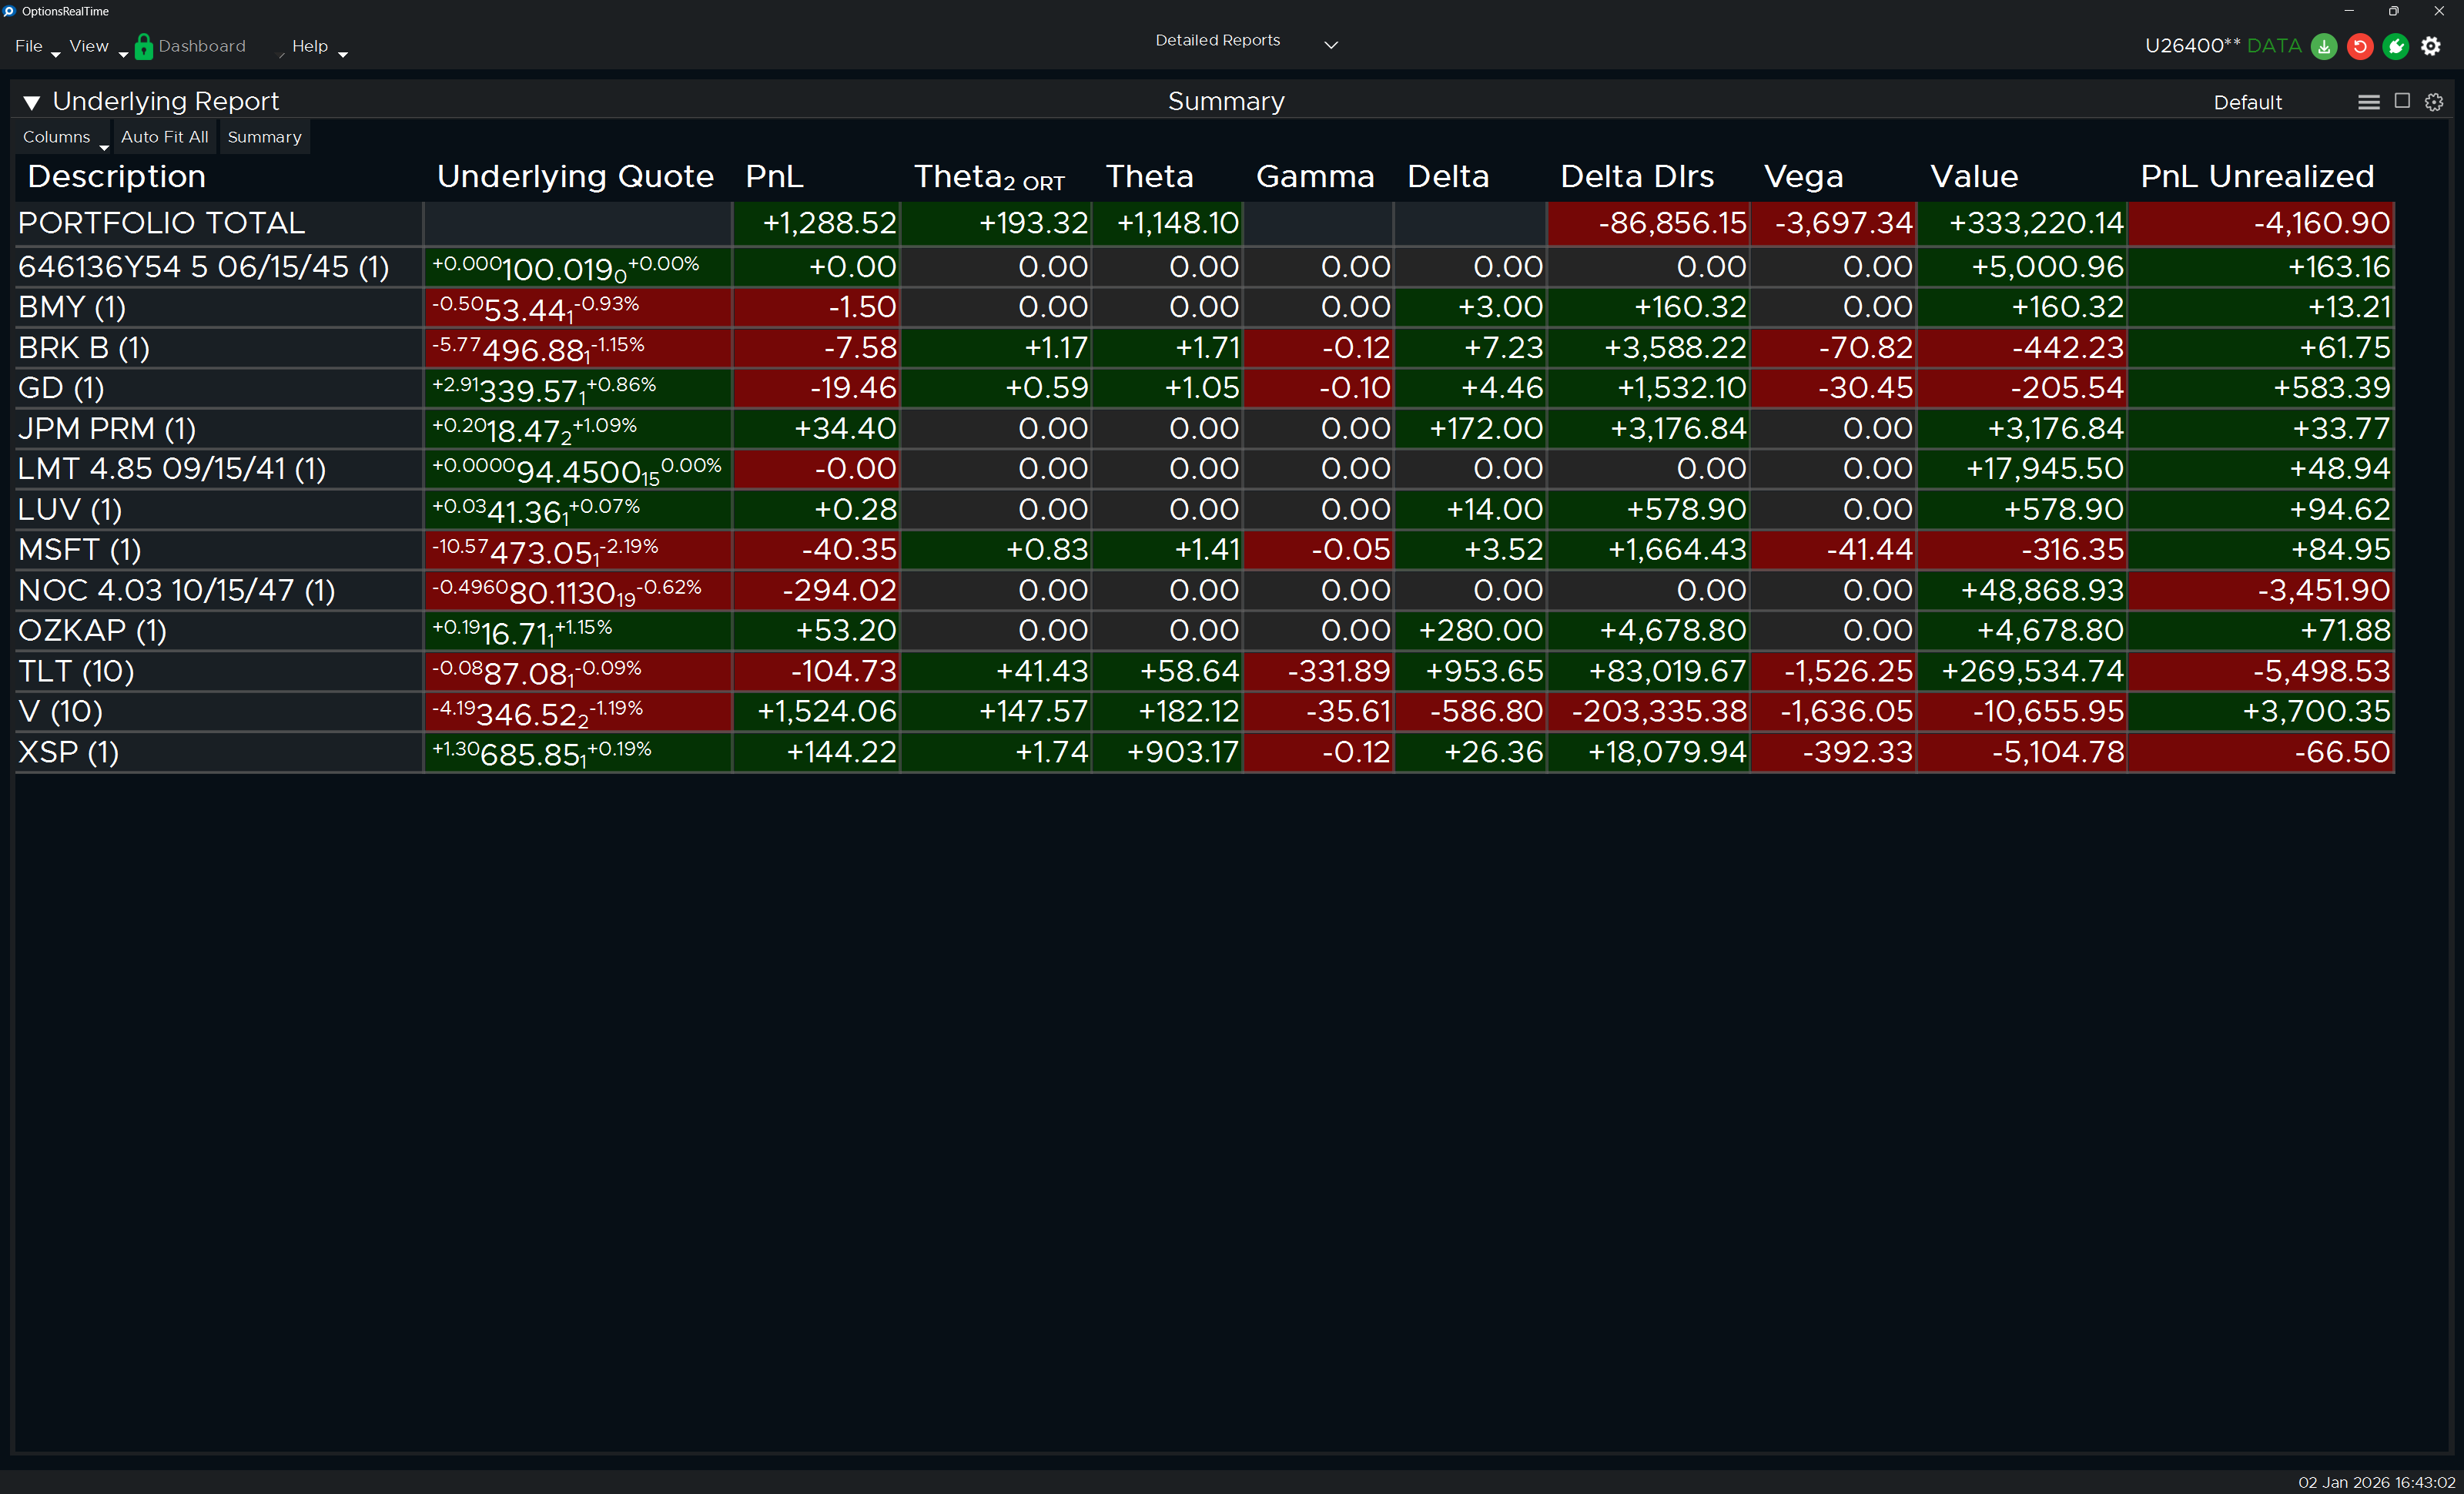
- Underlying Report: Groups positions by underlying symbol
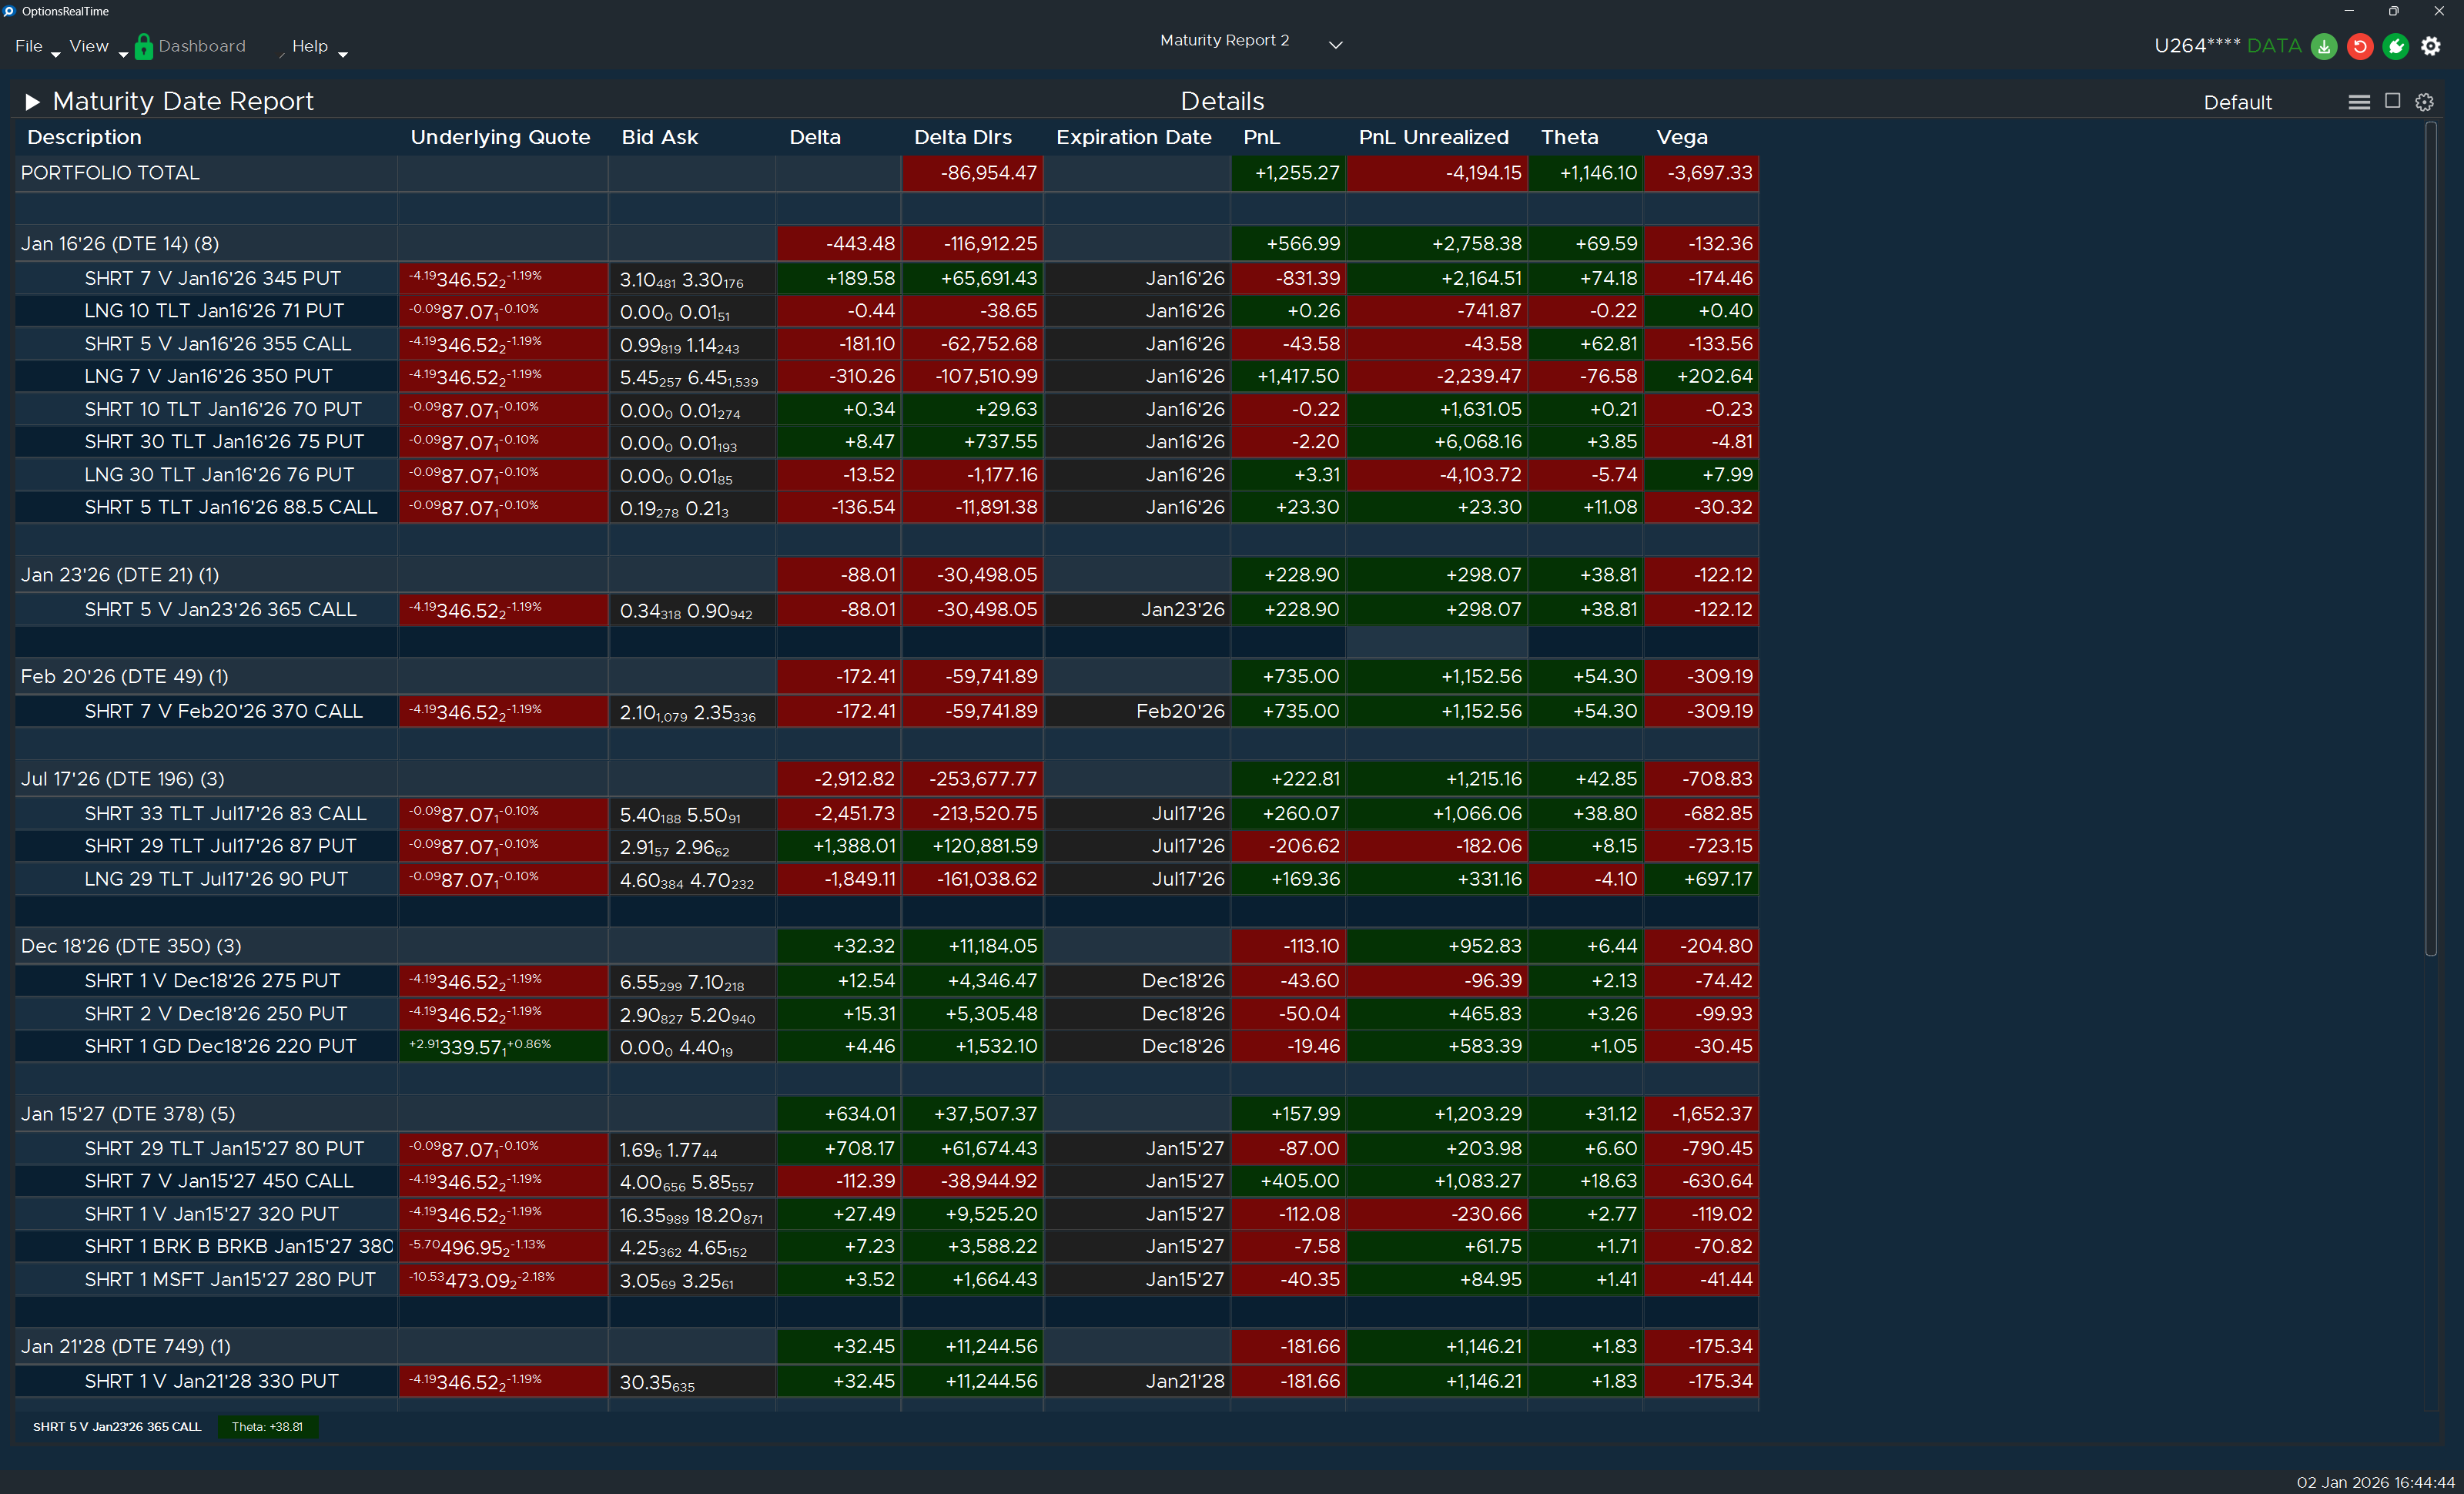
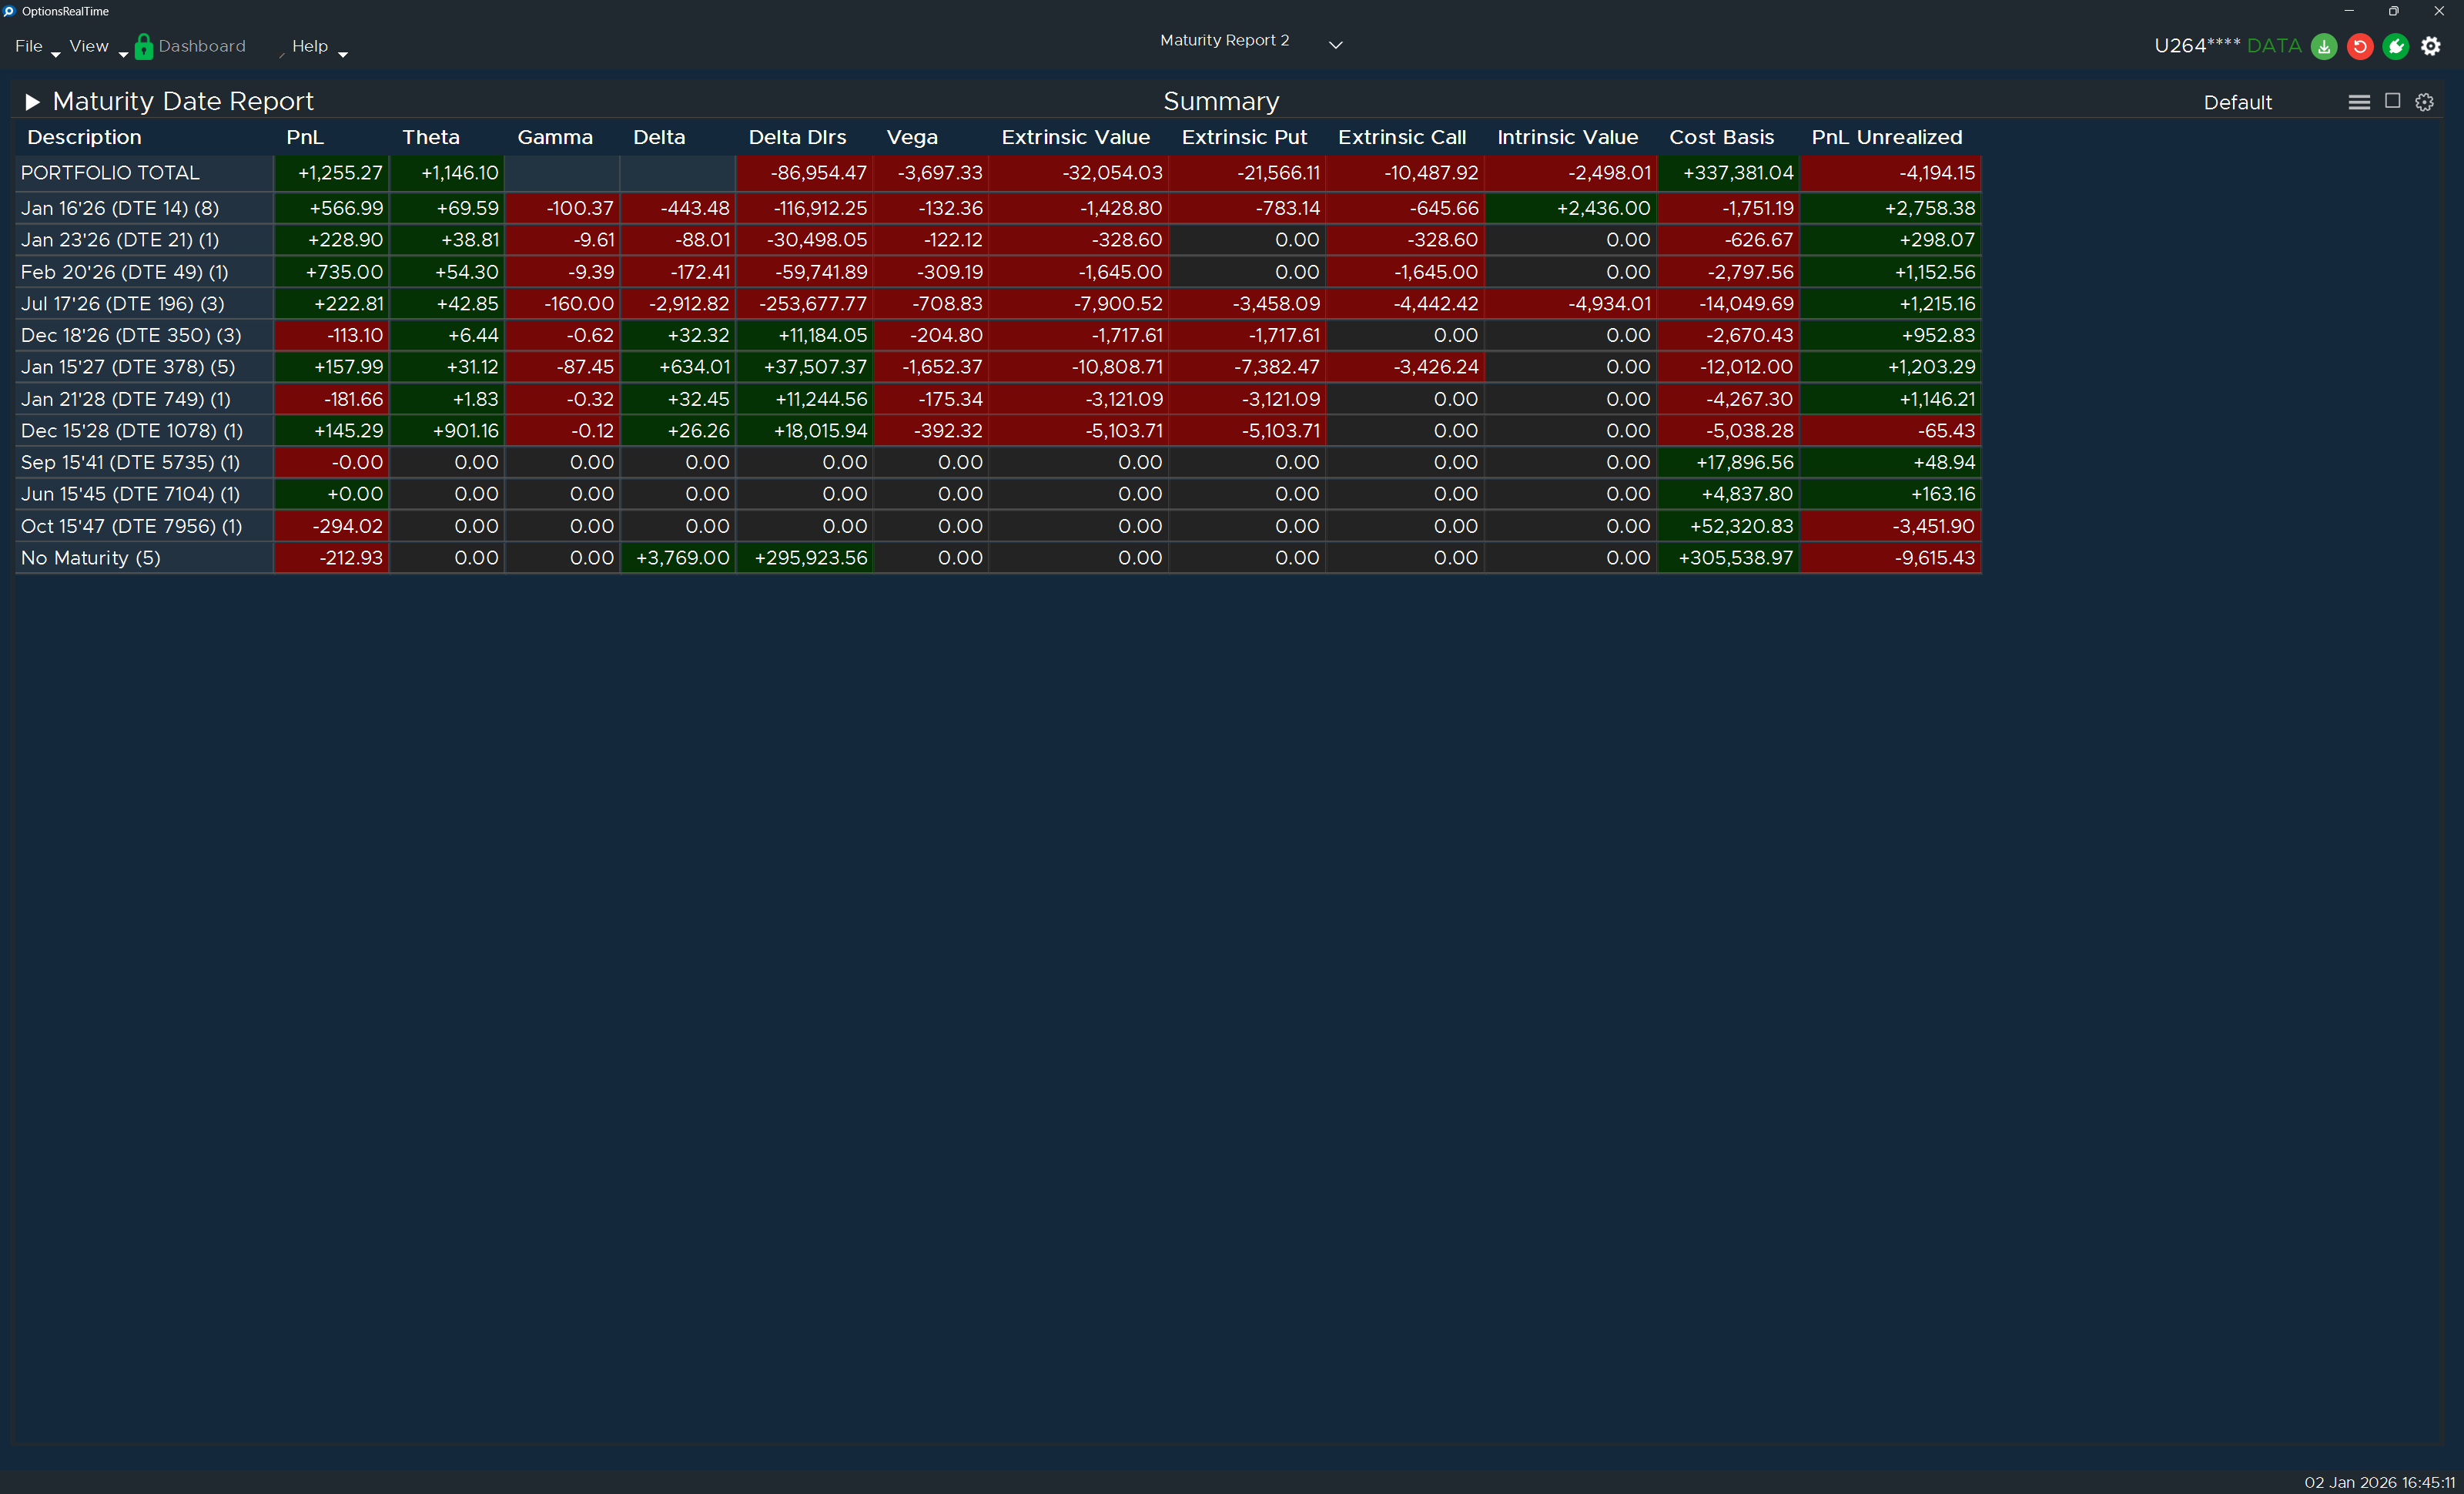
- Maturity Report: Groups positions by maturity date
Both reports share identical features and controls.
Detail vs. Summary View
Section titled “Detail vs. Summary View”Toggle the Details/Summary button to switch between:
- Details: Shows all individual positions
- Summary: Shows positions aggregated (summed) by the grouping dimension where appropriate
Filtering
Section titled “Filtering”The report header includes filter controls that allow you to narrow down which positions are displayed. Each filter operates independently and can be combined for precise control over the view. Filters apply to both reports available—the Maturity Report and the Underlying Report.
Available Filters
Section titled “Available Filters”-
Underlying: Filter by underlying symbol (e.g., MSFT, SPY, TLT). Select one or more symbols to display only positions in those underlyings.
-
Type: Filter by security type:
- BILL (Treasury bills)
- BOND (Bonds)
- CALL (Call options)
- CASH (Cash positions)
- FUT (Futures)
- IND (Index)
- PUT (Put options)
- STK (Stocks)
-
Pos’n: Filter by position direction:
- FLAT (No position)
- LONG (Long positions)
- SHORT (Short positions)
-
Expiry: Filter by expiration or maturity date. Options include N/A for non-expiring securities, plus all option expiration dates and bond maturity dates present in your portfolio.
Using Filters
Section titled “Using Filters”Click the checkbox next to any filter category to open a dropdown menu. Select the values you want to include in the display. The report updates immediately to show only positions matching your selected criteria. Multiple filters can be active simultaneously—for example, filtering for MSFT and SPY underlyings while also filtering for only CALL and PUT types.
Filter settings are saved with the panel configuration.
Control Panel
Section titled “Control Panel”Click the chevron in the upper-left corner to access the control panel:
- Columns: Select which columns to display
- Auto-Fit: Adjusts all column widths to fit cell contents
- Copy Detail Layout → Summary: Copies the current column structure from the Details view to the Summary view
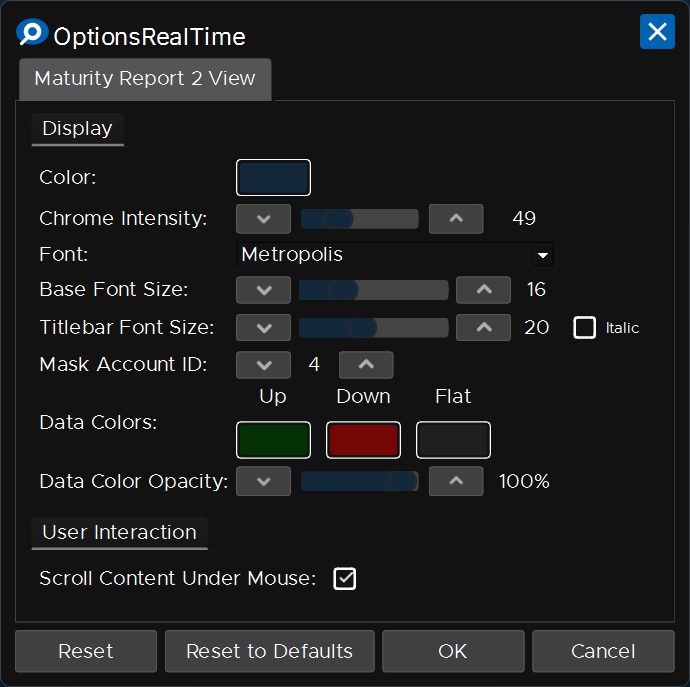
Dashboard Appearance Settings
Section titled “Dashboard Appearance Settings”Like all panels, basic report appearance can be customized through the Dashboard Settings dialog:
- Color: Base color theme for the panel
- Chrome Intensity: Adjusts the intensity of UI chrome elements
- Font: Font family used throughout the report
- Base Font Size: Controls the size of data values
- Titlebar Font Size: Controls the size of labels and headers
- Italic: Toggles italic styling for titlebar text
- Mask Account ID: Number of account ID digits to mask for privacy
- Data Colors: Background colors for positive (Up), negative (Down), and unchanged (Flat) values
- Data Color Opacity: Transparency level for data color backgrounds
- Scroll Content Under Mouse: When enabled, scrolling affects the panel under the cursor without requiring focus
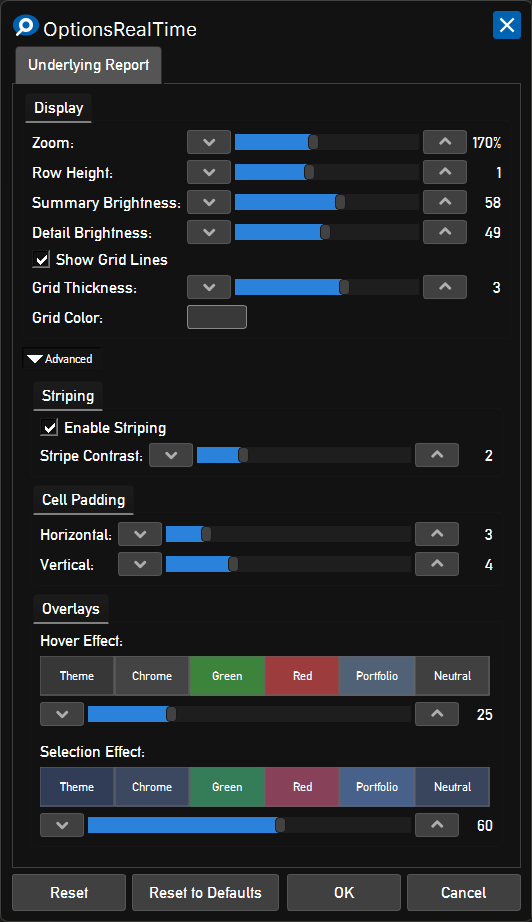
Report Settings
Section titled “Report Settings”Click the gear icon in the upper-right corner to access report-specific settings.
Display
Section titled “Display”- Zoom: Overall zoom level for the report (percentage)
- Row Height: Vertical spacing of rows
- Summary Brightness: Brightness level for summary/group header rows
- Detail Brightness: Brightness level for detail rows
- Show Grid Lines: Toggles visibility of grid lines between cells
- Grid Thickness: Thickness of grid lines when enabled
- Grid Color: Color of grid lines
Advanced
Section titled “Advanced”Striping
Section titled “Striping”- Enable Striping: Toggles alternating row background colors for improved readability
- Stripe Contrast: Intensity of the contrast between alternating rows
Cell Padding
Section titled “Cell Padding”- Horizontal: Horizontal padding within cells
- Vertical: Vertical padding within cells
Overlays
Section titled “Overlays”- Hover Effect: Visual effect when hovering over rows (Theme, Chrome, Green, Red, Portfolio, or Neutral) with adjustable intensity
- Selection Effect: Visual effect for selected rows (Theme, Chrome, Green, Red, Portfolio, or Neutral) with adjustable intensity
Mouse Controls
Section titled “Mouse Controls”- Mouse Wheel: Scrolls the report vertically
- Ctrl + Shift + Mouse Wheel: Zooms the report in and out