Portfolio Metrics
Portfolio Metrics are the same metrics as individual portfolio-level values such as Theta or PnL, but grouped in a flow container. As the panel is resized, metrics wrap and reflow within the container, each maintaining uniform width and height. Metrics can be reordered and the grouping will be saved. When dragging a metric, white borders appear around surrounding metrics indicating where the selected metric will be inserted.
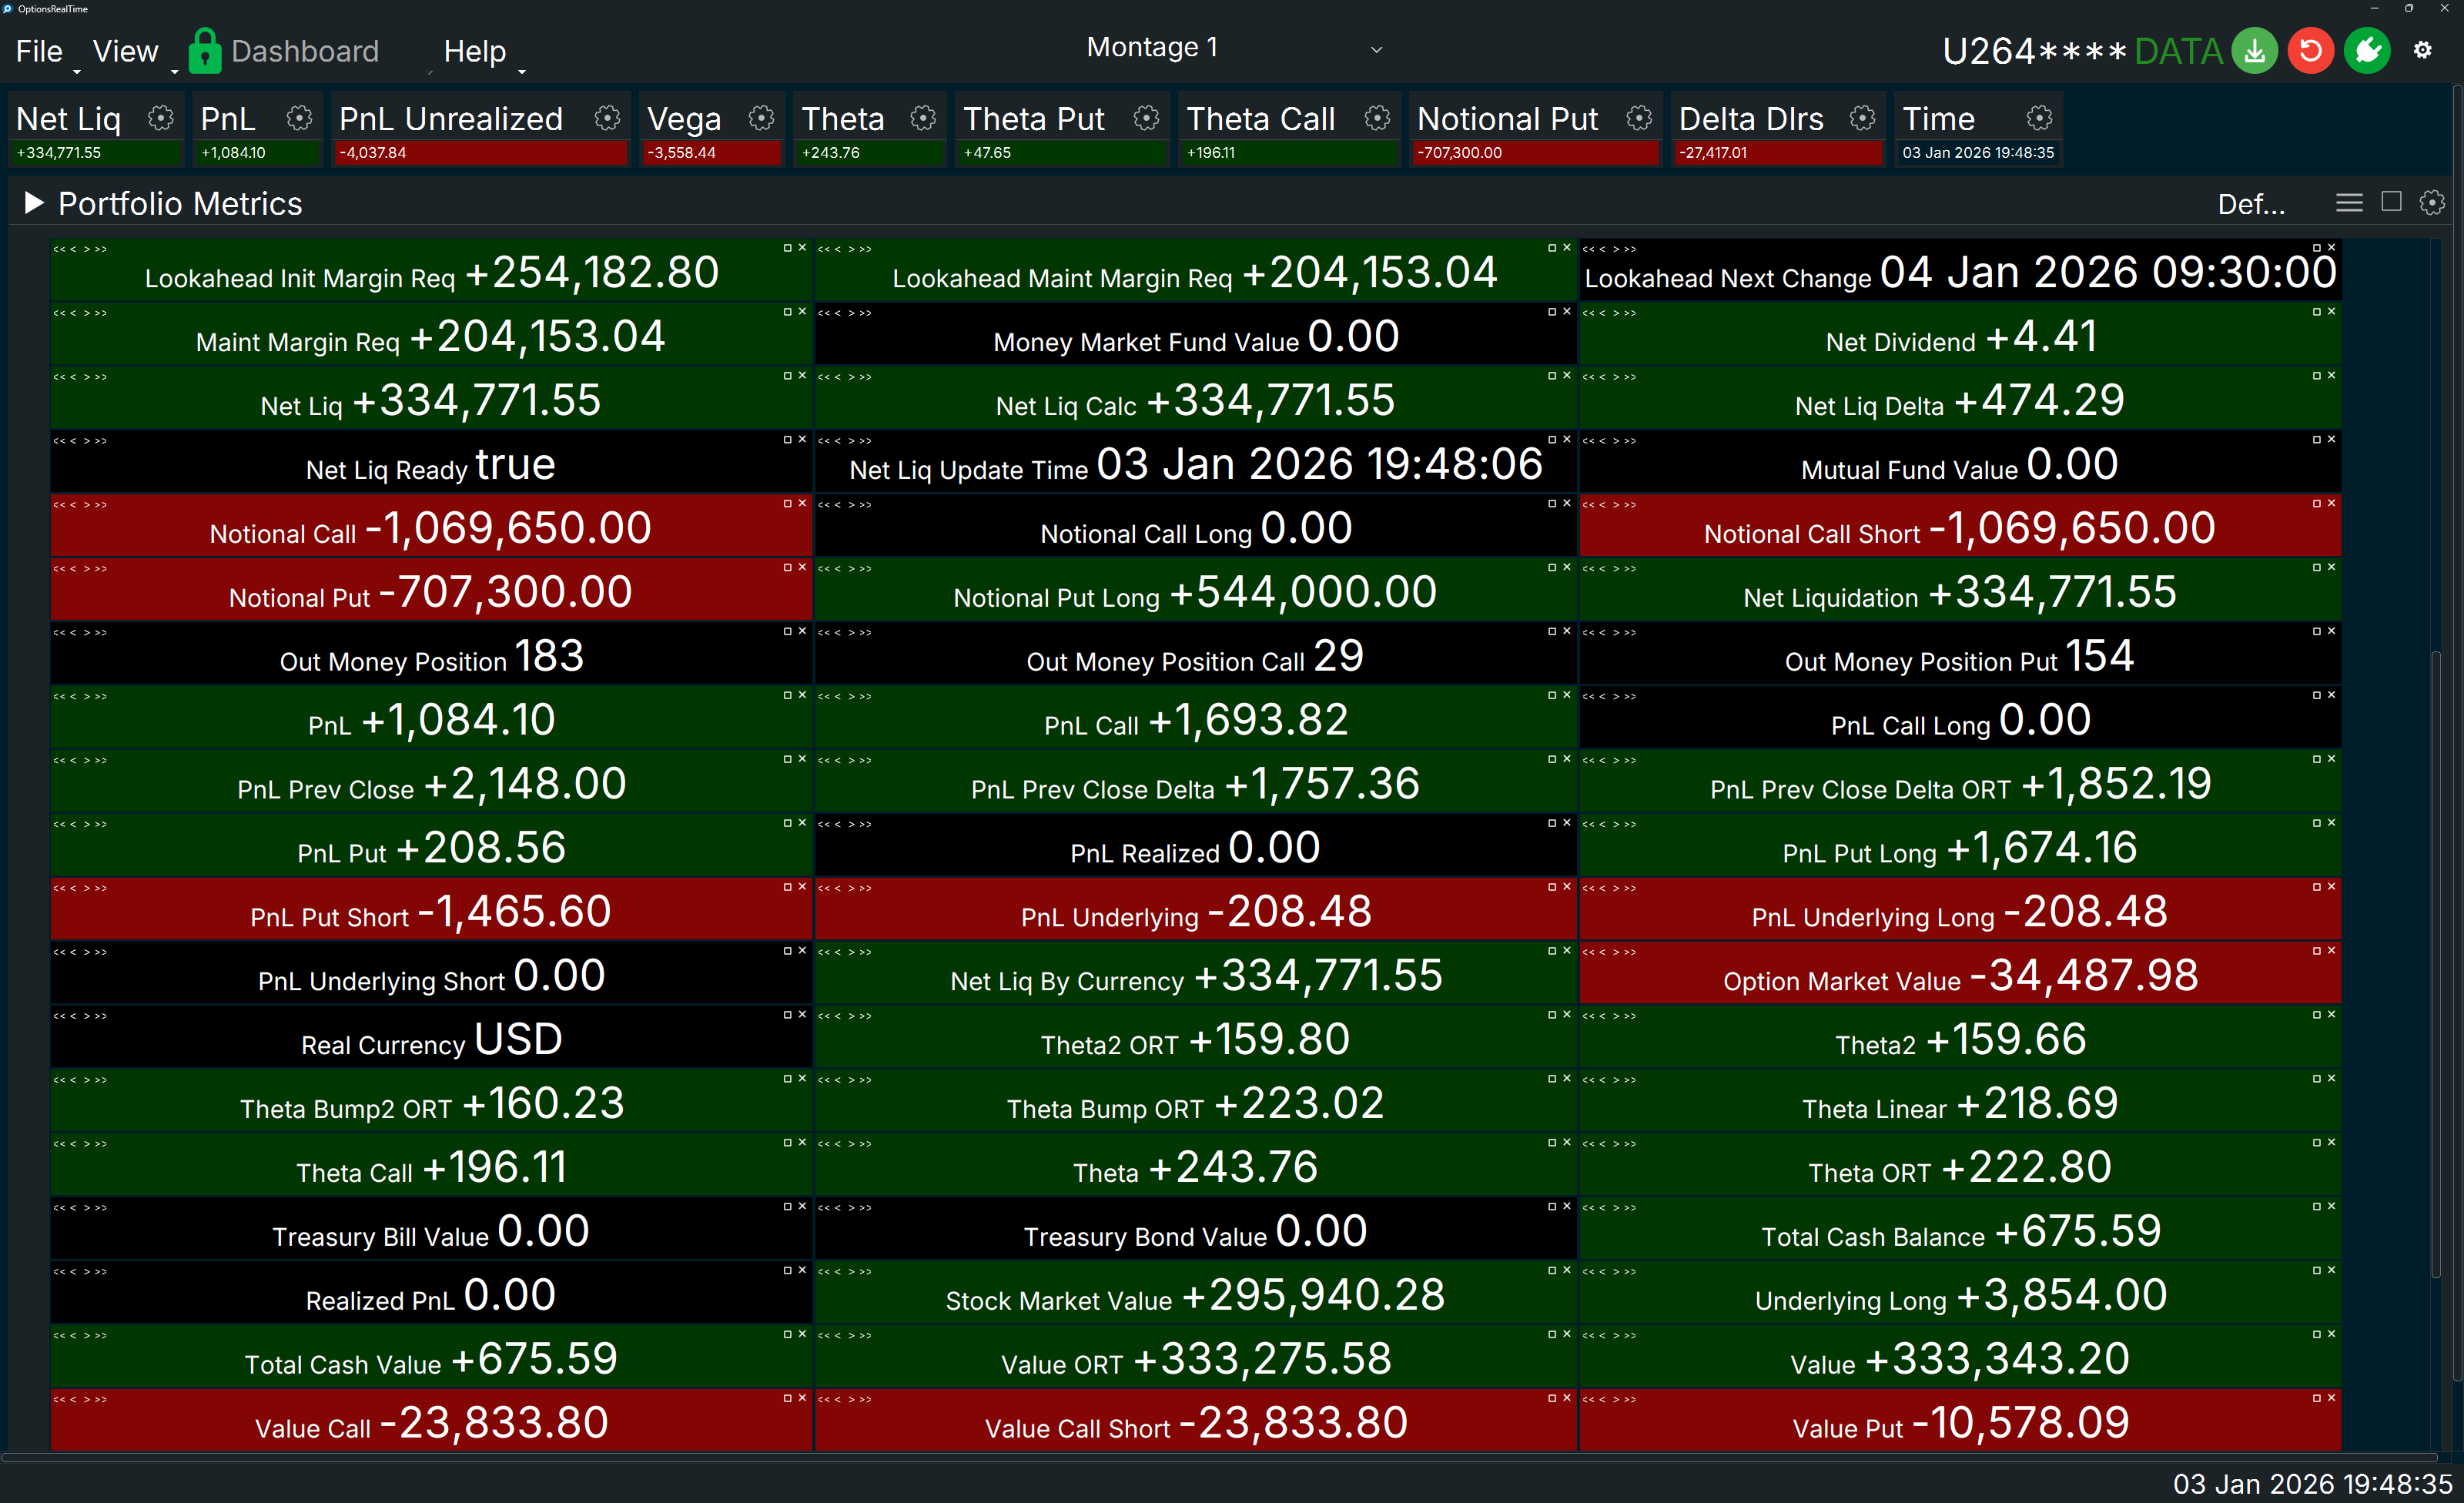
Display Settings
Section titled “Display Settings”- Label Font Size: Controlled by the Dashboard’s Titlebar Font Size setting, which applies to all panel labels
- Label Font Style: Controlled by the Dashboard’s Font setting, which applies to all panels
- Label Italics: Labels can be italicized via Dashboard settings
- Value Font Size: Controlled via the settings gear icon in the right corner
- Value Background Color: Displays positive, negative, or flat Data Colors from Dashboard settings (when applicable to that metric)
- Border Thickness: Controlled via the settings gear icon in the right corner
Container Controls
Section titled “Container Controls”Each metric in the container has controls in the upper corners.
Left Corner (Reorder)
Section titled “Left Corner (Reorder)”- <<: Move metric to front of container
- <: Move metric left
- >: Move metric right
- >>: Move metric to end of container
Right Corner
Section titled “Right Corner”- [ ]: Maximize / Restore - Toggles metric to fill its panel or restore to original size
- X: Hide the metric
Mouse Controls
Section titled “Mouse Controls”- Left-click drag: Drag metric to rearrange within the container
- Ctrl+Shift+Mouse Wheel: Zoom metrics in and out