Portfolio PnL Chart
The Portfolio PnL chart displays the total profit and loss of the portfolio plotted against time. This provides a real-time view of overall portfolio performance throughout the trading day.
The current PnL value is displayed at the top of the chart. A reference line and label can be shown to indicate the current value on the Y-axis.
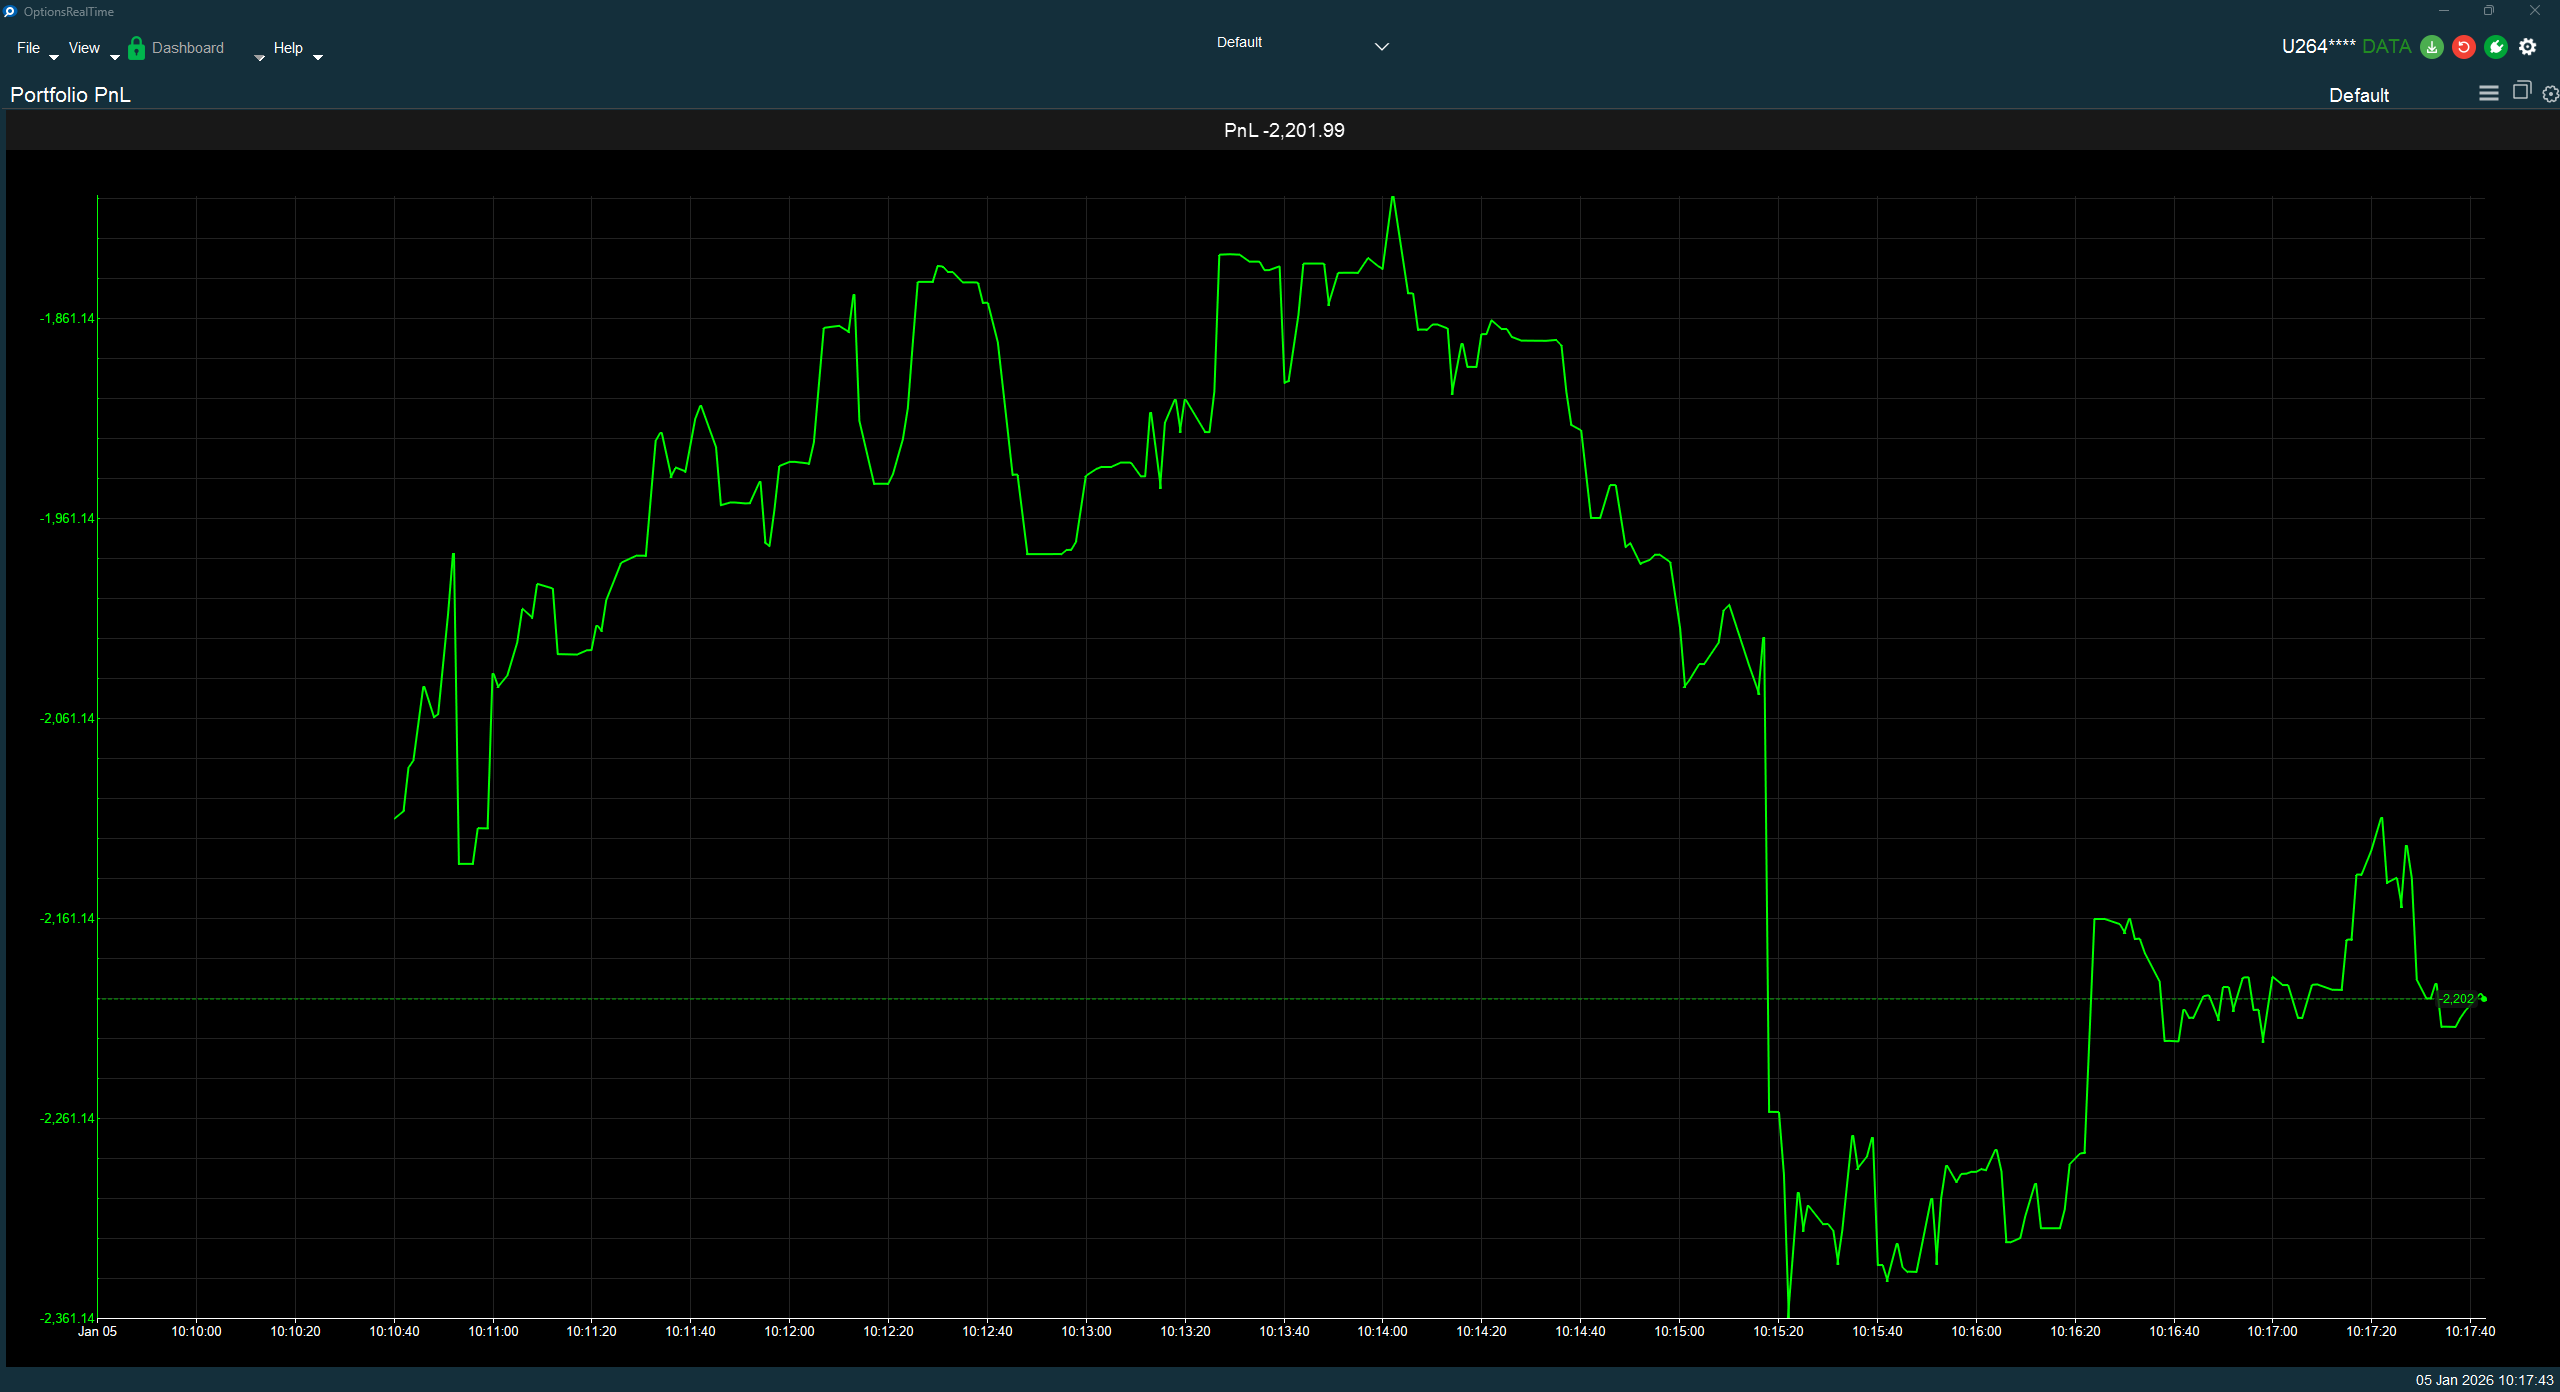
Chart Interaction
Section titled “Chart Interaction”Supports zooming and panning:
- Ctrl+Mousewheel: Zoom the chart
- Left-click drag: Draw a zoom rectangle, release to zoom to that area
- Right-click drag: Pan the chart
- Double-click: Revert to default view
- Refresh button (upper right): Revert to default view
Display Settings
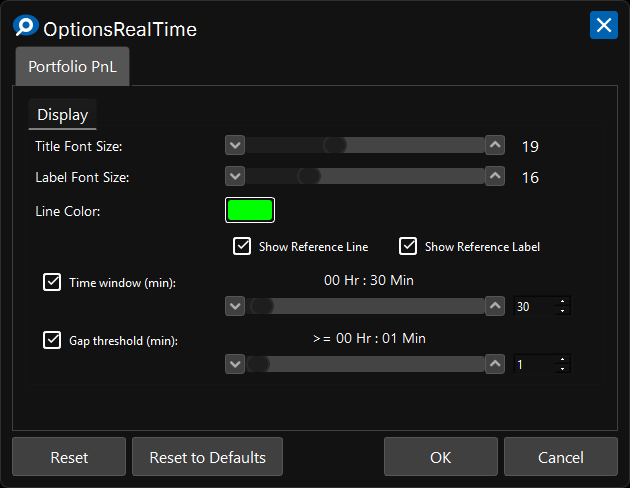
Section titled “Display Settings”In the upper right corner of the Portfolio PnL Chart is a gear icon for settings.
Display
Section titled “Display”- Title Font Size: Font size for the chart title
- Label Font Size: Font size for axis labels
- Line Color: Color for the PnL line
- Show Reference Line: Toggle visibility of the horizontal reference line at current value
- Show Reference Label: Toggle visibility of the current value label on the right edge
Time Window
Section titled “Time Window”- Time window (min): When enabled, limits the chart to display only the specified number of minutes
Gap Threshold
Section titled “Gap Threshold”- Gap threshold (min): When enabled, inserts a visual gap in the chart when data points are separated by at least the specified minutes