Maturity Chart
The Maturity chart shows how a selected metric is distributed across expiration dates. Three step charts display Total, Calls, and Puts values over time, allowing visualization of how portfolio exposure evolves through upcoming expirations.
The X-axis shows expiration dates with markers indicating days to maturity (DTM). The legend distinguishes position types: Long ITM (in the money), Long OTM (out of the money), Short ITM, and Short OTM.
Available metrics:
- Cost Basis
- Delta$
- Extrinsic Value
- Intrinsic Value
- Notional
- PnL
- Theta
- Unrealized PnL
- Value
- Vega
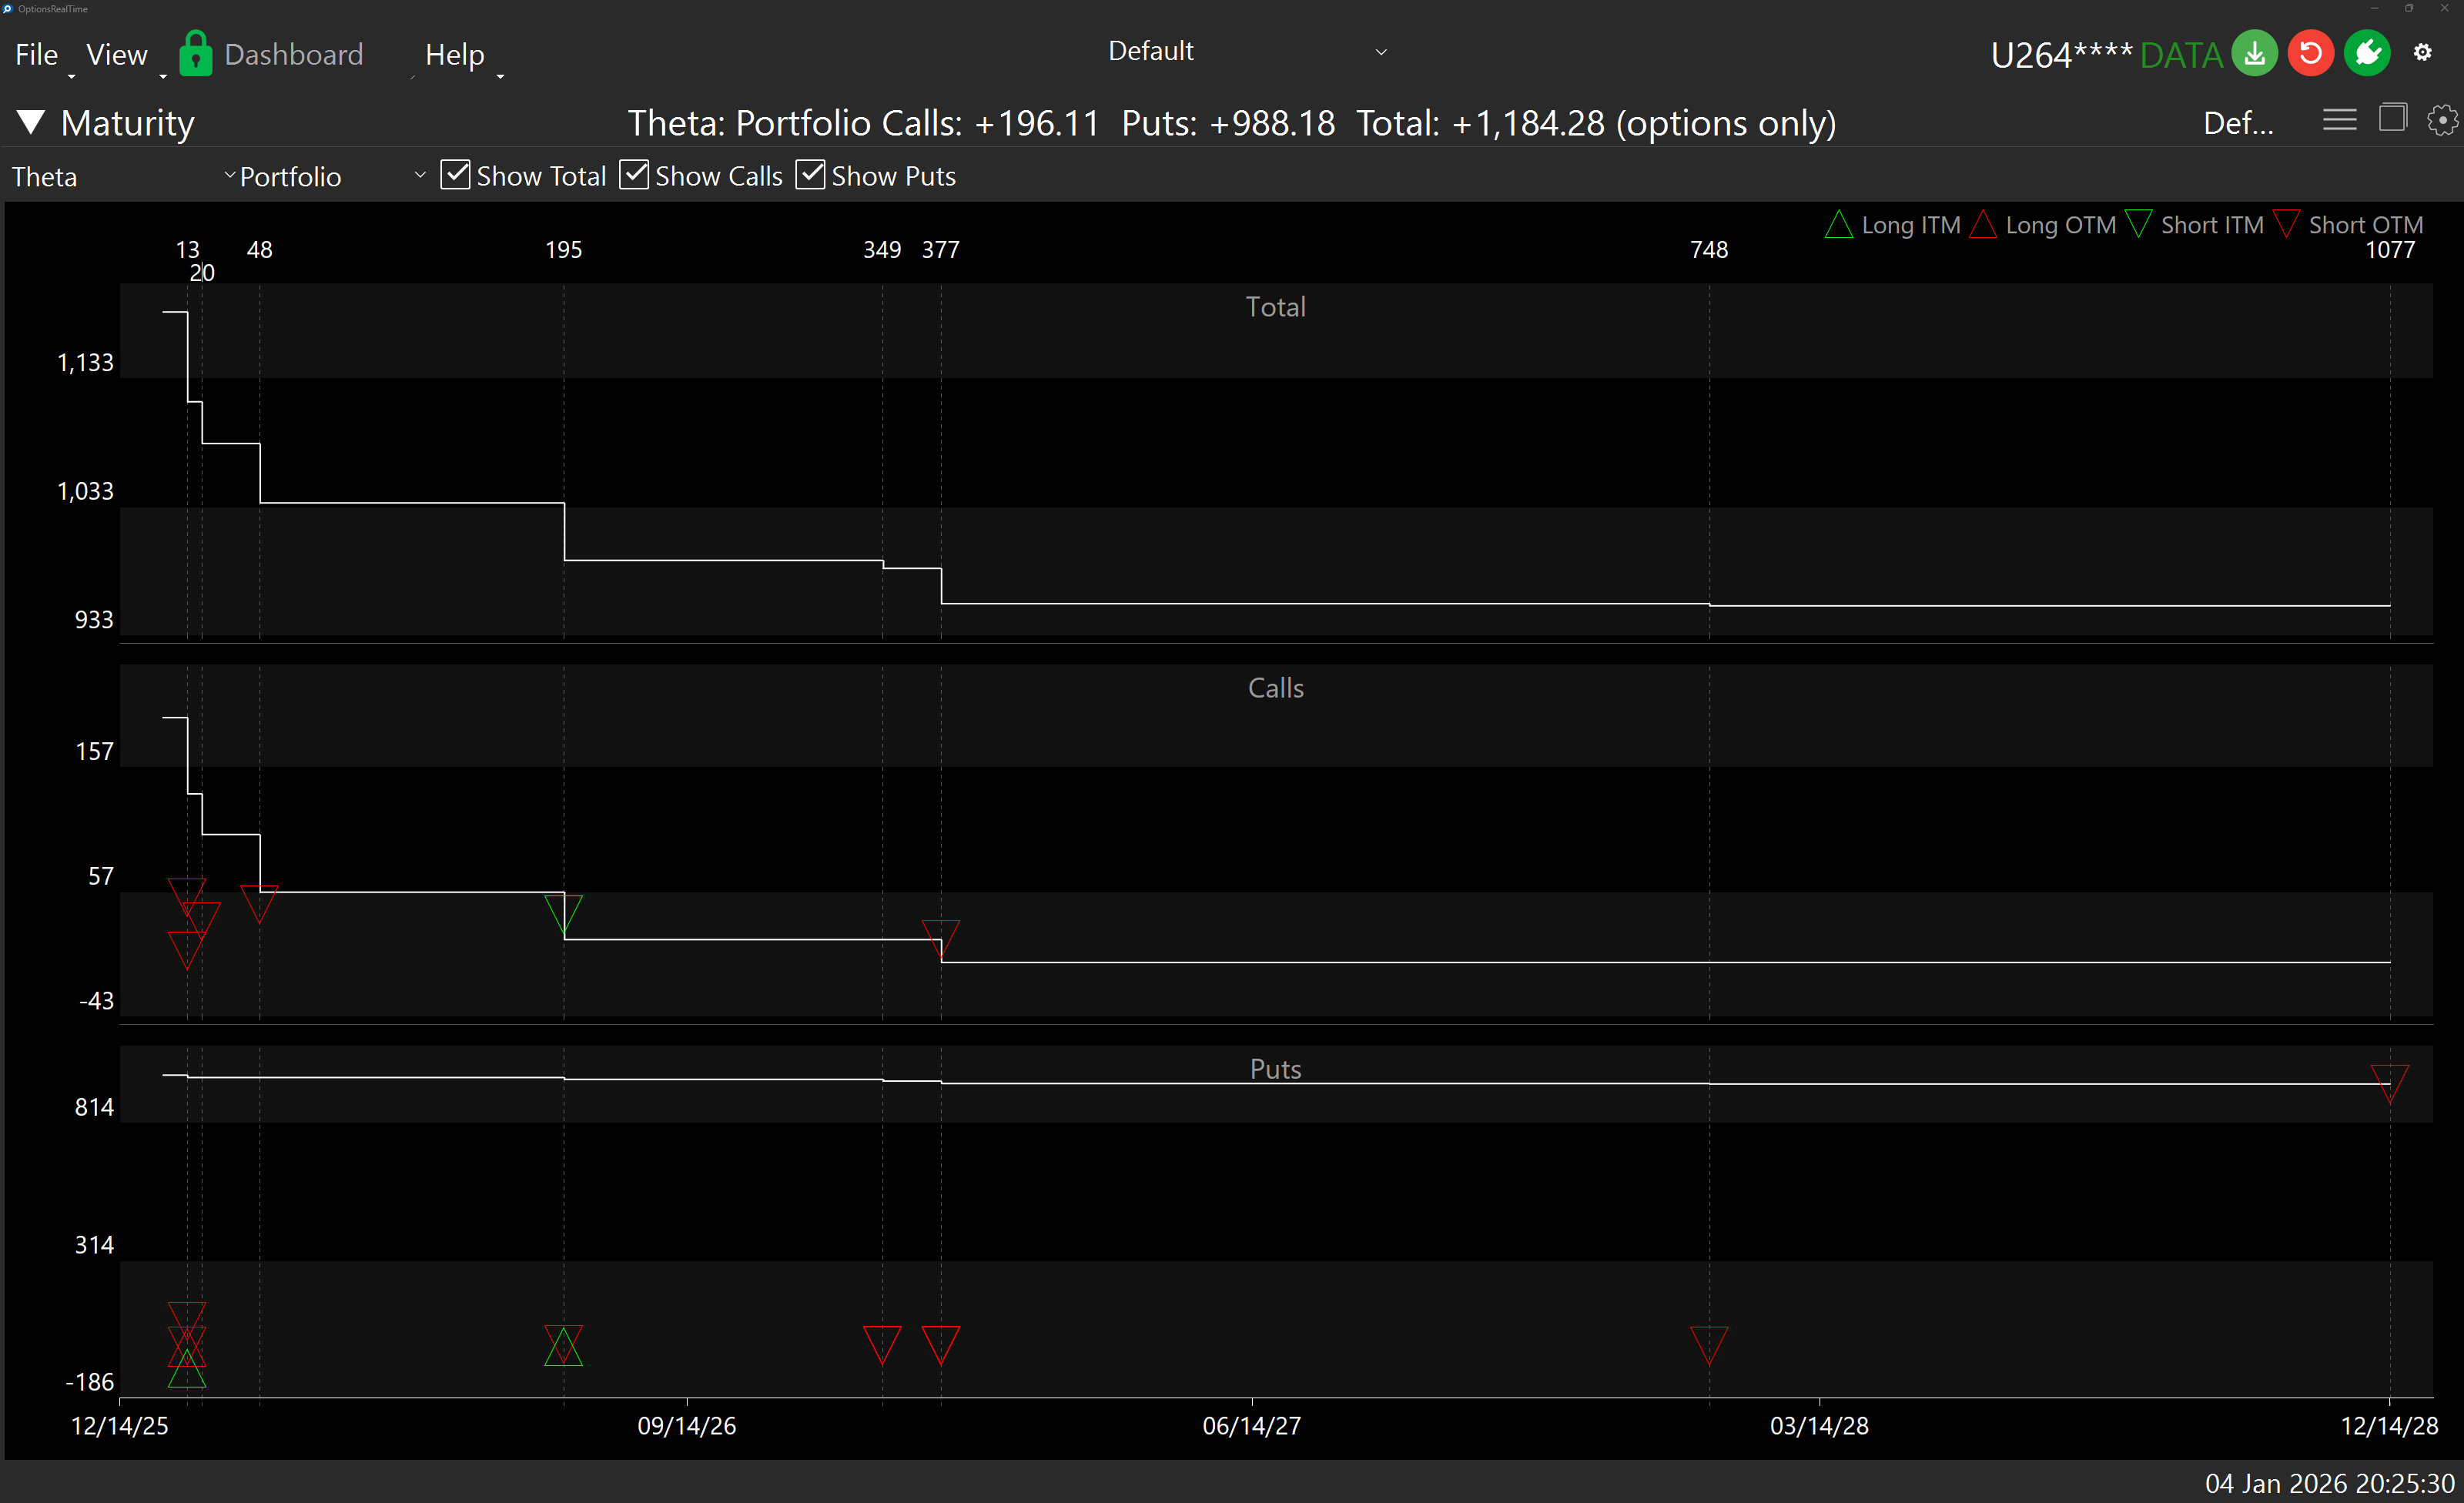
Chart Interaction
Section titled “Chart Interaction”Each chart supports zooming and panning:
- Ctrl+Mousewheel: Zoom the chart
- Left-click drag: Draw a zoom rectangle, release to zoom to that area
- Right-click drag: Pan the chart
- Double-click: Revert to default view
- Refresh button (upper right): Revert to default view
Position Detail Popup
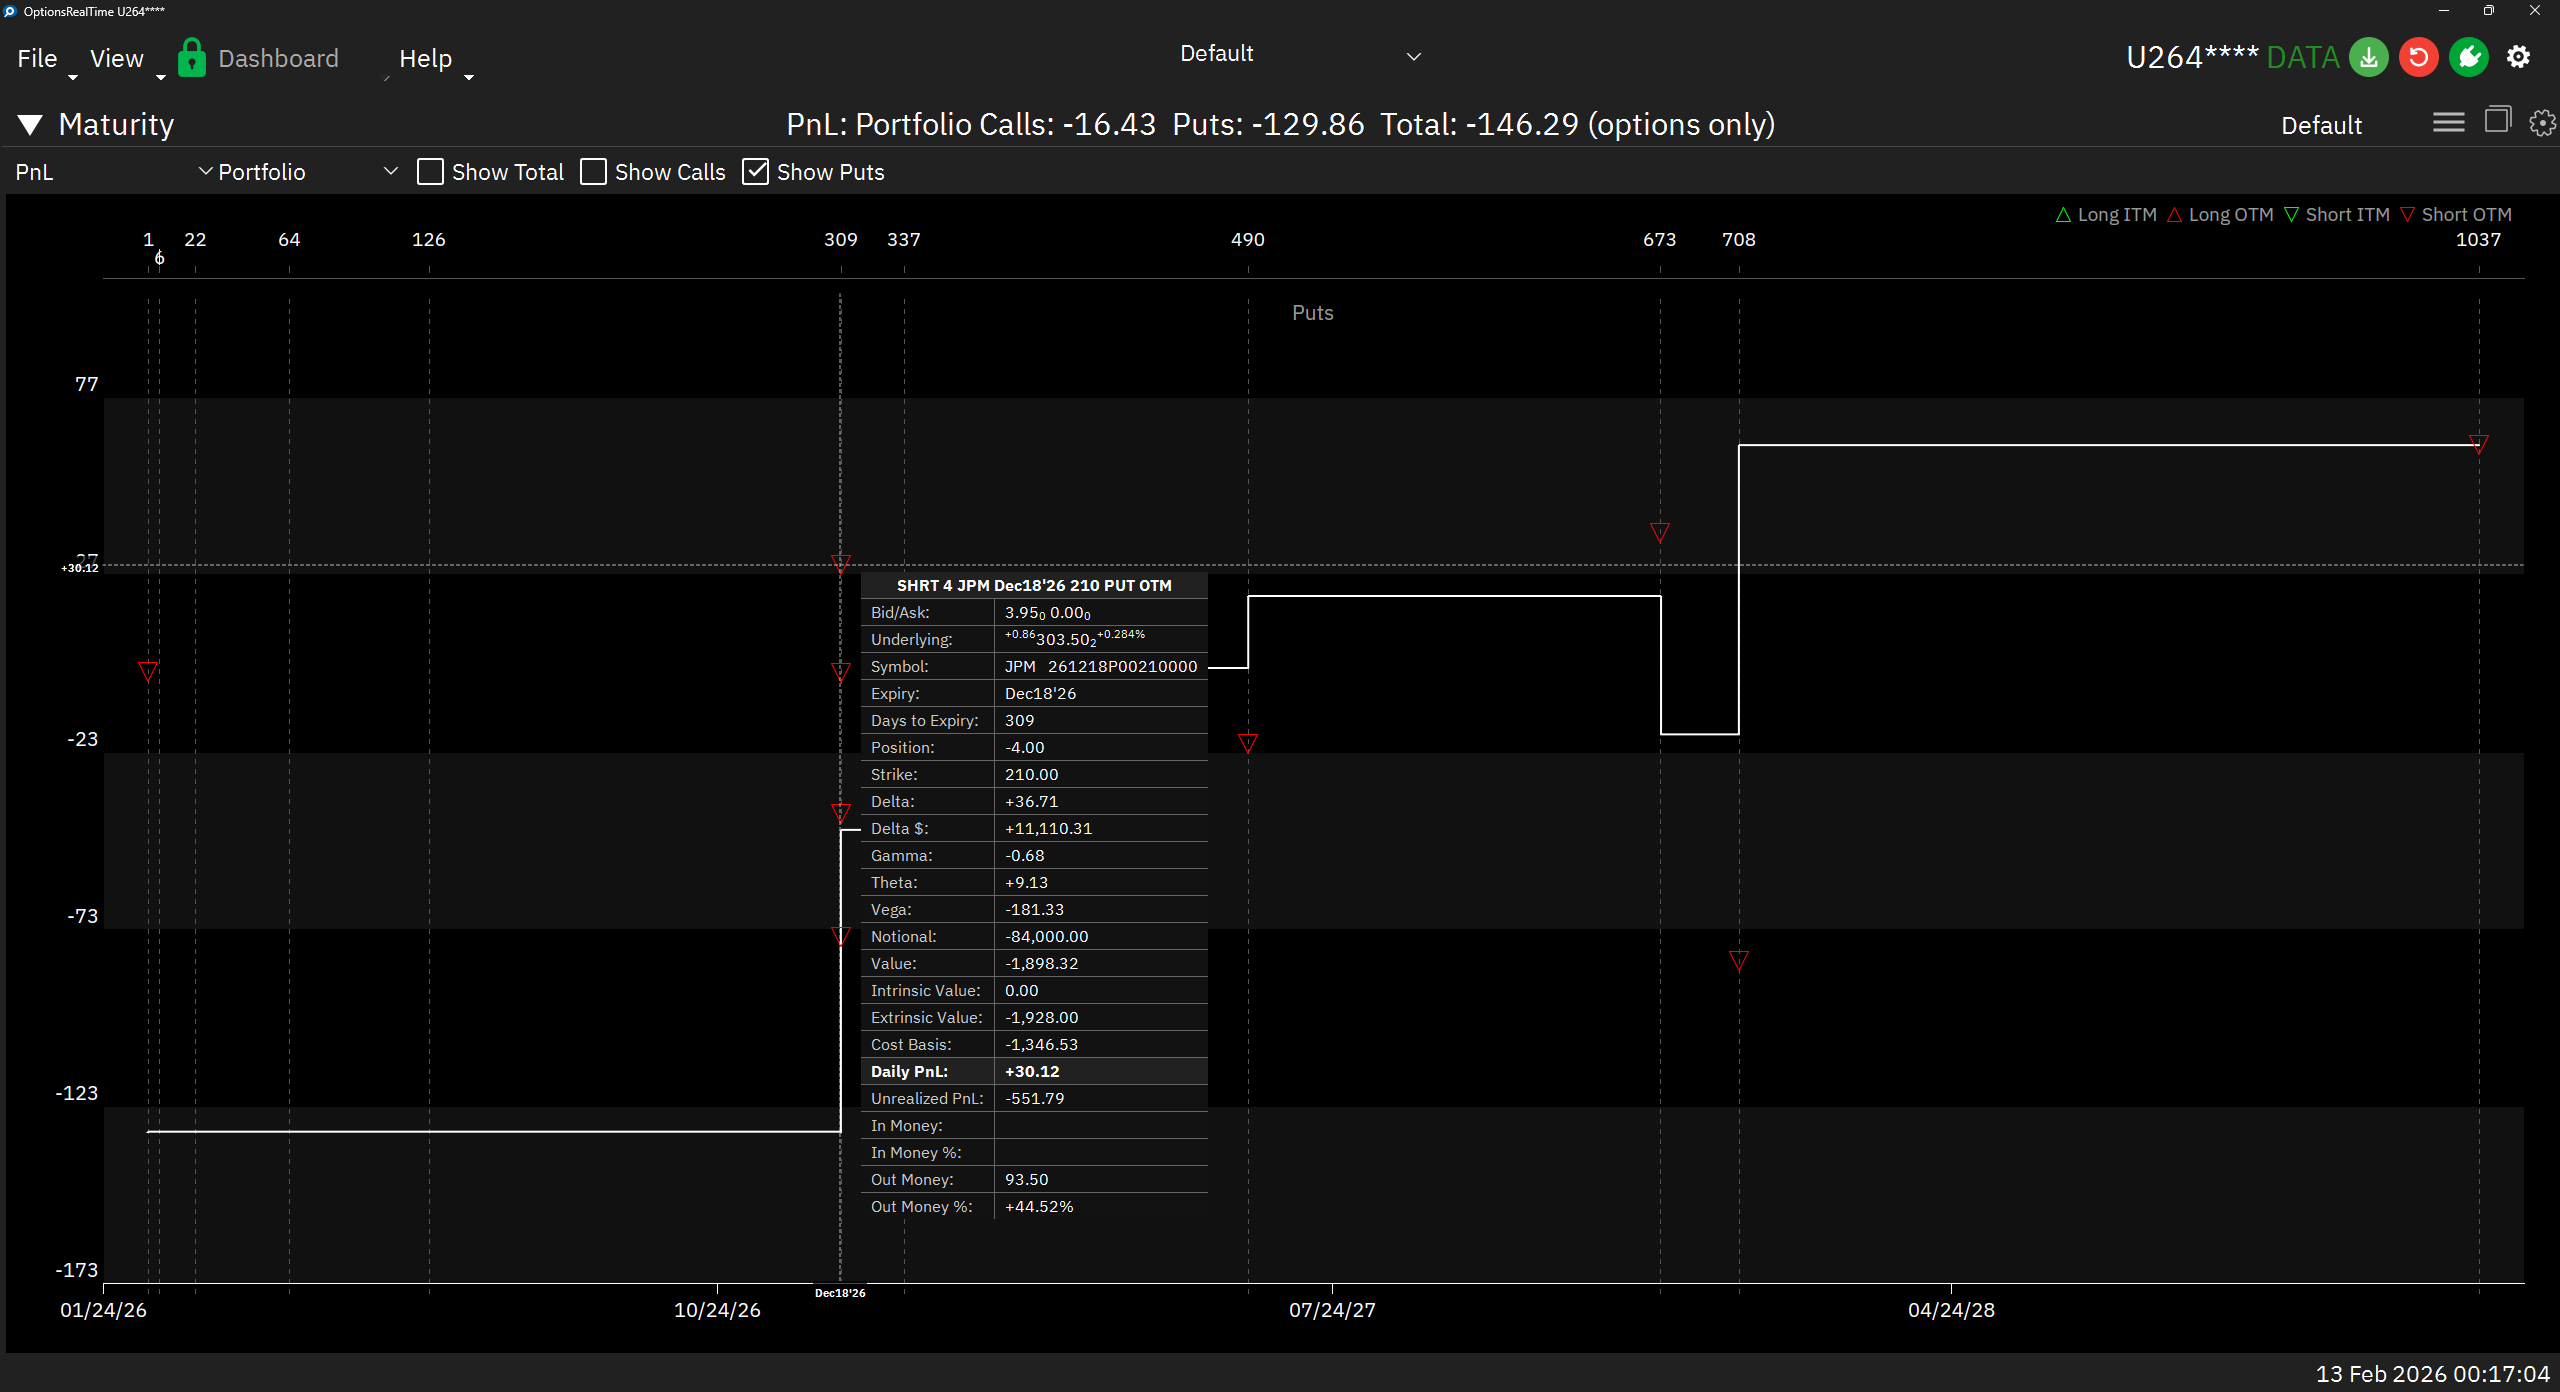
Section titled “Position Detail Popup”Hovering over a triangle marker on the chart displays a live popup with detailed information about that individual option position. The popup updates in real time as market data ticks in.
The popup includes:
- Header: Position summary (direction, quantity, underlying, expiry, strike, type, moneyness)
- Market Data: Bid/Ask, underlying quote
- Contract: Symbol, expiry, days to expiry, position, strike
- Greeks: Delta, Delta $, Gamma, Theta, Vega
- Exposure: Notional value
- Valuation: Value, intrinsic value, extrinsic value, cost basis
- P&L: Daily PnL (highlighted when the selected metric matches), unrealized PnL
- Moneyness: In/out of the money amounts and percentages
The row corresponding to the currently selected metric is highlighted in the popup, making it easy to see how each position contributes to the charted value.
Display Settings
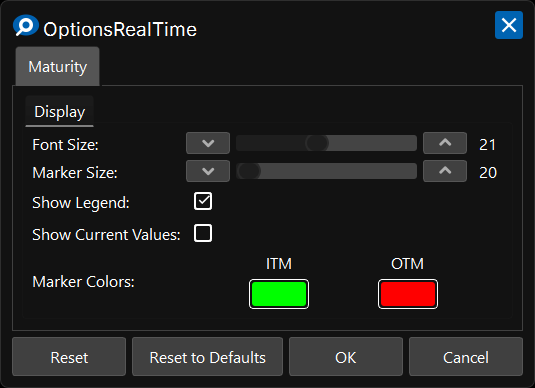
Section titled “Display Settings”In the upper right corner of the Maturity Chart is a gear icon for settings.
Display
Section titled “Display”- Font Size: Font size for axis labels
- Show Legend: Toggle visibility of the position type legend
- Show Current Values: Display the current metric total on the left Y-axis of each plot
Marker Colors
Section titled “Marker Colors”- ITM: Color for in the money position markers
- OTM: Color for out of the money position markers
Control Panel
Section titled “Control Panel”In the upper left corner of the Maturity Chart, next to its label, is a chevron which can be clicked to toggle the visibility of an additional control panel. The control panel contains:
- Metric Selector: Choose which metric to display (PnL, Delta$, Theta, etc.)
- Underlying Selector: Choose which underlying to analyze, or select Portfolio to view all positions across all underlyings
- Show Total: Toggle visibility of the Total chart
- Show Calls: Toggle visibility of the Calls chart
- Show Puts: Toggle visibility of the Puts chart